Interface Overview
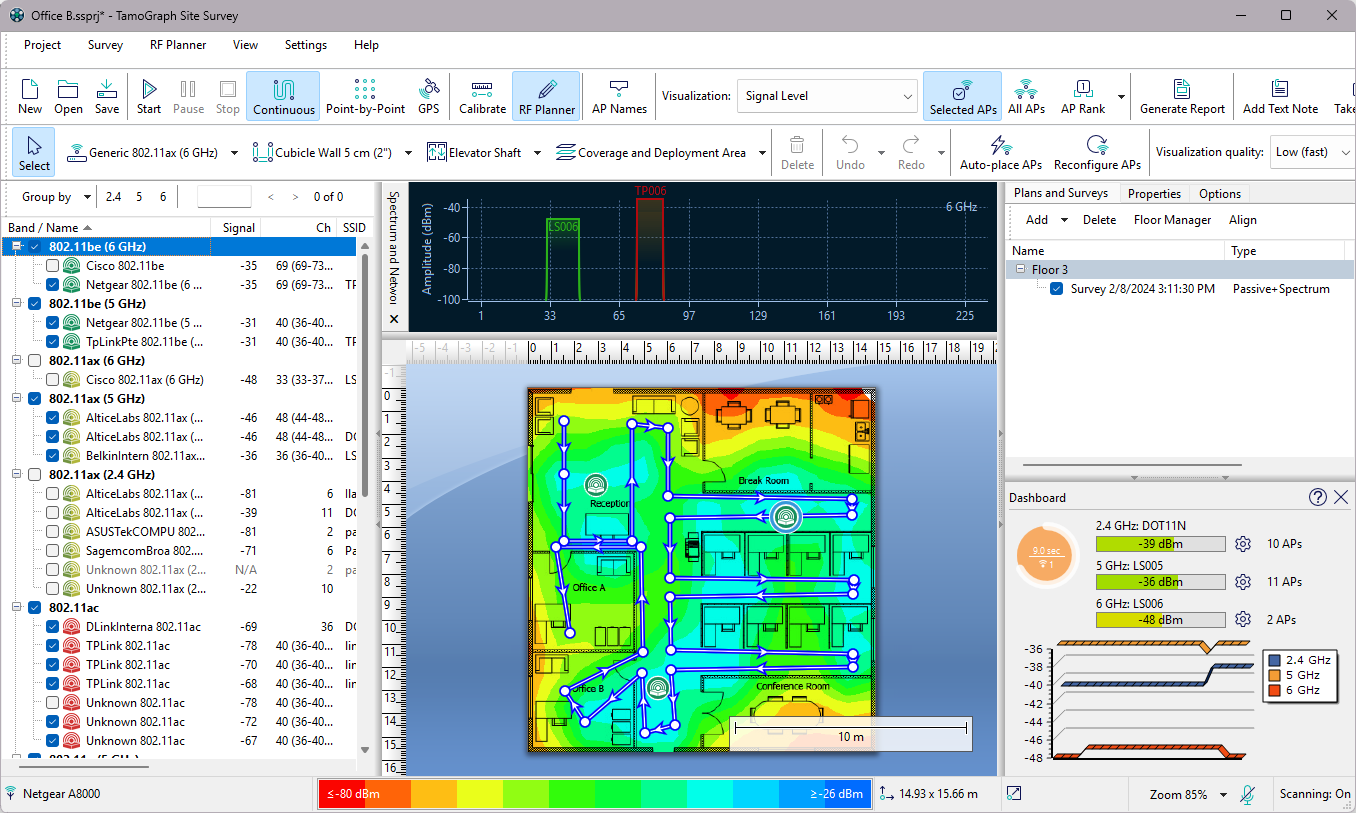
The application main window includes the following elements:
- The resizable left-side panel displays an AP list of the APs detected by the scanner or the ones that are present in the imported projects.
- The central area is used for displaying the floor or site plan image, survey paths, and visualizations of analyzed data.
- The resizable right-side panel allows you to manage project floor plans and collected survey data, as well as to configure various project options and settings.
You can hide and show the left and right panels using the vertical splitter or through the menu commands View => Left Panel and View => Right Panel.
In addition to the three main elements, the application contains the main toolbar (provides quick access to frequently used commands), the RF Planner toolbar (used in predictive modeling for drawing virtual objects; not shown by default), and the status bar (provides information on the wireless adapter and scanner status, current floor plan dimensions, coordinates, and zoom level, as well as the legend for the currently selected visualization).
The following chapters describe the functionality of these elements in detail.
Access Point List
The left application panel is used to display the list of APs detected by the application (if you have a compatible adapter installed.) It also displays virtual APs if you perform predictive modeling. You can use the Group by button to group APs by band, channel, SSID, name, or custom group. Grouping by SSID is the best method in a corporate WLAN environment, where all the WLAN's APs share the same SSID.
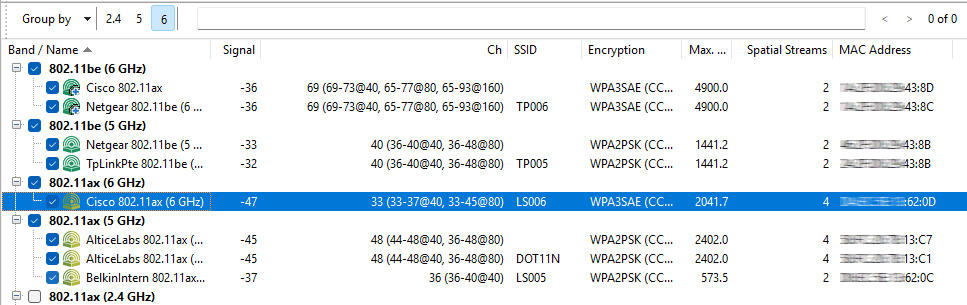
The AP list displays key AP parameters in the corresponding columns: SSID, vendor, channel, current signal level in dBm, supported encryption type(s), maximum data rate in Mbps, the number of MIMO spatial streams, and MAC address. If the vendor is unknown, the AP name is preceded by Unknown. If the vendor name is known, the AP name is preceded by the vendor name followed by the AP type. Additionally, for Cisco APs, TamoGraph will try to find and use AP names assigned by the administrator. You can rename APs by right-clicking on them and selecting Rename. To restore the original name, simply delete a user-assigned name by hitting the backspace key. If the AP uses channel bonding (several 20 MHz channels), the channel set is shown in parentheses after the primary channel number. For 802.11ac, 802.11ax, and 802.11be APs, several channel sets might be shown, e.g., for the 40 MHz and 80 MHz modes. You can customize the columns by right-clicking on the list header or change their order by dragging them. The APs that are not currently audible are shown in grey font, and their signal level is shown as N/A.
The AP icons are color-coded to reflect the 802.11 bands and standards they use:
 |
2.4 GHz 802.11b |
 |
2.4 GHz 802.11g |
 |
2.4 GHz 802.11n |
 |
5 GHz 802.11a |
 |
5 GHz 802.11na |
 |
5 GHz 802.11ac |
 |
2.4, 5, and 6 GHz 802.11ax |
 |
2.4, 5, and 6 GHz 802.11be |
The check boxes next to the APs play a very important role: They should be used for selecting the APs you want TamoGraph to analyze. When the Selected APs mode is enabled on the toolbar, data visualizations for passive surveys include only the APs that have checked boxes next to them.
To quickly select the APs that belong to the same frequency band (2.4, 5, or 6 GHz), you can use the buttons located above the AP list. Pressing a button selects all the APs that belong to the corresponding band, while pressing it again removes the selection. The same functionality is available by right-clicking on the AP list and using the Select All, Select 2.4 GHz, Select 5 GHz or Select 6 GHz APs or Deselect All APs commands. The right-click menu also allows to disable or enable the Ignore APs if max. signal is below option (see AP Detection and Placement for more information.) If the list of APs becomes too long and you prefer to not see the APs that are currently outside the range, select Advanced => Remove Inactive APs. This will remove the APs that have been outside the range for longer than two minutes. The Advanced => Re-link Multi-SSID command may be useful when working with linking multi-SSID APs; for more information, see the corresponding chapter.
If the AP signal is strong enough and if a sufficient number of readings has been recorded, TamoGraph computes the AP location and places the corresponding icon on the site map. Those APs that are present on the site map have a small blue plus (+) sign in the lower right corner of their icons. The Find approximate AP locations command allows you to re-calculate the original estimated AP location(s) of either all or only the highlighted AP if you changed the locations by moving AP icons with the mouse or performed additional surveys. If an AP was not automatically placed on the site map and you want to place it there, you can drag the AP icon from the AP list to the site map. To remove it from the site map, drag the AP icon outside or use the Clear Access Point Locations command. See Adjusting AP Locations for more information. Virtual APs that were created by the user for predictive modeling have a small blue “V” sign in the lower right corner of their icons; such APs cannot be auto-located or dragged off the site map.
When working with dozens of APs, it might be difficult to find the corresponding entry on the AP list for a given icon on the site map and vice versa. To help you with this task, two visual feedback mechanisms exist:
- When you select an AP icon on the site map, the corresponding item on the AP list is highlighted in grey color. If a multi-SSID AP has been selected, multiple corresponding items on the AP list are highlighted (one per radio).
- When you double-click an item on the AP list, the corresponding AP icon on the site map blinks a few times (assuming that the corresponding AP icon is shown on the site map). If the AP icon is not within the site map’s visible area, the site map is automatically scrolled to ensure that the icon is visible.
You can also use the Search function to find APs by name, vendor, SSID, or MAC address (BSSID). To do this, use the search field located above the AP list and enter some text or part of a MAC address. If matches are found, they will be highlighted, and the selection line will be placed on the first match. To the right of the search field, you can see the total number of matches and the current match number. The “left” and “right” buttons can be used to navigate to the previous or next match.
Custom Groups
One of the possible AP grouping methods is by “Custom Group”. This method might be used if you have a grouping criterion that is not covered by the standard grouping methods, such as by SSID or by band. For example, you may want group APs by their location. Initially, APs are not assigned to any group. To create groups and assign APs to them, use the Custom Group menu. Under this menu, you can Add selected APs to an existing or new group (by “selected,” we mean the APs that are currently checked in the AP list) or Clear grouping for all or selected APs. You can also Manage all groups. When you use the Manage command, the application displays a dialog listing all APs and their membership in the groups. Initially, all APs are marked as Ungrouped. You can create new groups, rename them, delete them, and move one or several APs to any group via drag-and-drop. Note that an AP cannot be assigned to multiple groups; it can be assigned either to one group or to no group. Groups are project specific, which means that they exist only within a given project. You cannot create or manage groups when no project is open.
Floor Plan / Site Map
This central area of the application window is used for displaying the floor plan or site map. When you perform a passive or active site survey, you use the floor plan to mark your current location. As you move and click on the plan, TamoGraph will show your walkabout path and the area you have covered, as shown on the illustration below:
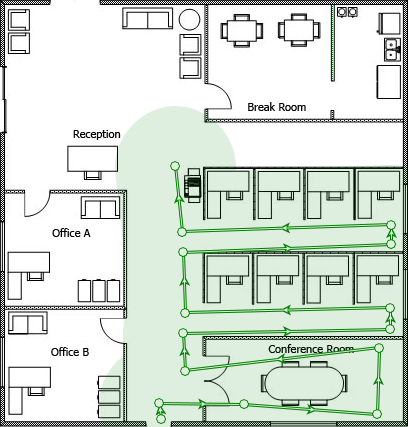
The application status bar displays the map dimensions and your current coordinates when you hover the mouse over the map. To zoom in our out, use the mouse scroll wheel or the Zoom button on the status bar. To pan the map, use the vertical and horizontal scroll bars or press and hold the space bar and drag the map while holding the left mouse button. If you are using a computer with a multitouch display, you can use the two-finger pinch zoom gesture to zoom in or out and the two-finger pan gesture to pan.
When you are through surveying the site, you can use the Visualization drop-down list on the toolbar to have TamoGraph display data visualizations for your site (e.g., signal level or AP coverage areas).
Plans and Surveys, Properties, and Options Panel
This panel gives you access to virtually all the application and project settings. Using this panel, you can manage floor plans or conducted surveys, configure requirements for your wireless network, change the scanner settings, select color schemes for your visualizations, etc. For a detailed description of these functions, refer to the Configuring TamoGraph chapter.
Main Menu
The application menu commands are described below. Some menu items are located in different places in the Windows and macOS versions.
Project
- New – launches a new project wizard.
- Open – opens a previously saved project.
- Save – saves the current project.
- Save As – saves the current project under a different name.
- Close – closes the current project.
- Generate Report – opens the report generation dialog.
- Save Current Visualization – saves the currently selected visualization and legend to an image file.
- Clear Recent List – clears the list of recently opened project files.
- Exit – closes the application.
Survey
- Start – starts data collection.
- Pause – suspends data collection temporarily.
- Stop – stops data collection or site map calibration.
- Continuous – turns on the continuous data collection mode.
- Point-by-Point – turns on the point-by-point data collection mode.
- GPS – turns on the GPS data collection mode.
- Calibrate – allows you to set the map dimensions.
- Export Survey Data – exports collected data when the survey job is split between several computers.
- Import Survey Data – imports collected data when the split jobs need to be merged into one project.
- Take Photo – allows you to take a photograph and add it to your project.
RF Planner
- Auto-place APs – open the AP automatic placement wizard.
- Reconfigure APs – open the AP automatic reconfiguration wizard.
- Virtual Model – turns on or off the virtual model and, respectively, shows or hides all virtual APs and other objects used in predictive modeling.
View
- Left Panel – shows or hides the left panel.
- Right Panel – shows or hides the right panel.
- Main Menu – shows or hides the main application menu. To show it again, press ALT or use the View context menu on the central pane.
- Main Toolbar – shows or hides the toolbar in the main application window.
- RF Planner Toolbar – shows or hides the toolbar for editing virtual objects used in predictive modeling.
- Status Bar – shows or hides the application status bar.
- Full Screen – expands the main application window and hides all other applications. To exit full screen mode, press F11 or use the View context menu on the central pane.
- Vertical Ruler – shows or hides the vertical ruler.
- Horizontal Ruler – shows or hides the horizontal ruler.
- Legend – shows or hides the legend on the map.
- Spectrum and Networks – shows or hides the spectrum and networks analysis pane. This item is enabled only when the project contains spectrum or passive data or when a compatible adapter or a USB spectrum analyzer is plugged in.
- Dashboard – shows or hides the Dashboard panel with a set of real-time data indicators.
- Access Points – shows or hides AP icons. This applies to both virtual APs and real-world APs.
- Walkabout Paths – shows or hides survey paths.
- Virtual Objects – shows or hides virtual objects (walls, attenuation areas, AP auto-placement areas, and floor areas) that were created as part of predictive modeling.
- Media Objects – shows or hides icons that represent photographs taken during surveys.
Settings
- Interface Font – allows you to change the interface font.
- Language – allows you to change the interface language.
- GPS Settings – allows you to configure your GPS receiver.
- Camera and Voice Settings – allows you to configure a camera for adding photos to your project and voice recognition setting for controlling the application using voice commands.
- Adapter Signal Level Correction – allows you to adjust the signal strength reported by your Wi-Fi adapter.
- AP Ignore List – allows you to configure the list of APs to be ignored by the application.
Help
- Contents – displays help documentation.
- Contents (PDF) – displays help documentation in PDF format.
- Driver Installation Guide – displays driver installation guide.
- Check for Updates – connects to the TamoSoft website and checks whether a newer application version is available.
- Activation – activates your registration key.
- About – displays information about the application.
Dashboard
The Dashboard panel provides users with a real-time snapshot of the current Wi-Fi environment. You can show or hide the dashboard and change its location (left or right) using the View => Dashboard menu item.
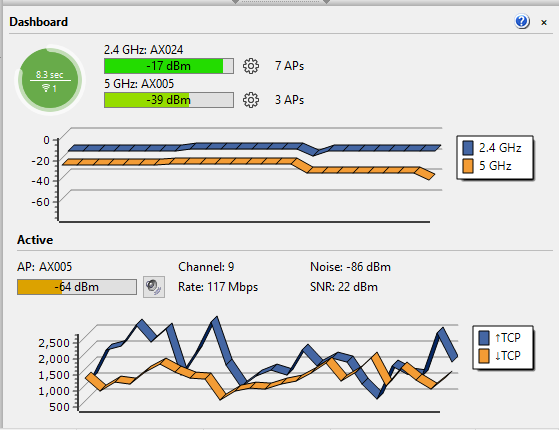
If TamoGraph detects a Wi-Fi adapter that can be used for passive surveys, the dashboard includes the following indicators:
- Scanner progress – the circular indicator that visualizes the scanning progress. The circle represents a scan cycle, i.e. the time needed to sweep all selected channels once.
- Scanner cycle duration – the text above the horizontal line inside the circle that indicates the time in seconds needed to sweep all selected channels once.
- Number of available adapters for passive surveys – the number below the horizontal line inside the circle that indicates the number of adapters being used for passive surveys.
- Scanner cycle duration recommendations – the color of the circle that indicates whether the scan cycle duration is optimal. A green circle indicates optimal scan cycle duration. A yellow circle indicates somewhat lengthy scan cycle duration. A red circle indicates that scan cycle duration is too long and needs to be shortened for better results. Hovering the mouse pointer over the circle reveals a hint window with extended information and recommendations.
- Current signal strength – three bar indicators (for the 2.4, 5 and 6 GHz bands) that display the signal strength of the APs being monitored. Clicking on the gear icons to the right of the indicators allows you to specify which AP signals should be displayed. You can set the indictor to display either the signal of the strongest of the selected APs (by selected, we mean the APs that are checked in the AP list,) or the signal of the strongest AP for the selected SSID. Double-clicking on the bars toggles the display between signal strength in dBm and percent.
- Number of APs currently visible – three text labels (for the 2.4, 5 and 6 GHz bands) that display the number of APs that have been seen recently.
- Signal strength chart – three histograms (for the 2.4, 5 and 6 GHz bands) that display the signal strength history.
While performing active surveys, the dashboard panel is automatically expanded to include more data related to the active survey being conducted. This includes the associated AP name, channel number, PHY rate, noise, SNR levels (if available), and a chart that displays the metrics being measured: throughout, loss, round-trip time, PHY rate, and signal level. The speaker icon allows you to enable or disable signal level vocalization; when the button is pressed, the computerized voice will periodically pronounce the current signal strength as you conduct the active survey. Double-clicking on the AP name toggles the text between the AP name, its MAC address (a.k.a BSSID), and SSID.
Both charts can be customized by using the context menu that is displayed when you right-click on the charts.
Spectrum and Networks Panel
This panel provides a live view of the RF environment by displaying currently active APs on the spectrum chart. To display this panel, click View => Spectrum and Networks. APs are displayed taking into consideration their channel number(s), channel bandwidth, and signal level. Using the context menu, you can show one or two frequency bands (due to space constraints, displaying three bands at the same time is not possible), and enable or disable SSID labels and gradients. Checking the Networks => Highlight selected menu item allows you to highlight the network that is currently selected in the AP list on the left panel.
Note that the same panel is used to display spectrum data when you conduct spectrum surveys. See Spectrum Analysis for more information.