Configuring TamoGraph
Virtually all of the application and project settings can be configured using the right-side panel (if the panel is hidden, click View => Right Panel or click on the central part of the right splitter to have it displayed). This panel includes three tabs whose functionality is described below in detail.
Plans and Surveys
This tab displays a hierarchical list of the project floor plans or site maps and performed surveys, as shown below.
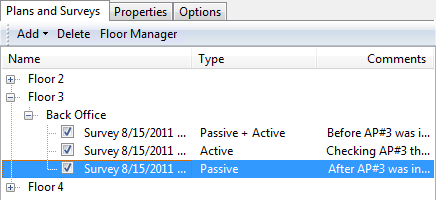
This list is an important tool that offers the following functionality:
- Add, rename, or delete floors (for multi-floor projects) and floor plans / site maps: The project hierarchy consists of floors, floor plans, and surveys. The top hierarchy level is a floor, which contains one or several floor plans. A floor plan contains one or several surveys (i.e., walkabout paths with associated data collected by TamoGraph). Adding a floor is optional. Your project does not necessarily have to have the top-level floor node; when you create a new project, a floor level is not automatically created, and your floor plan becomes the top-level node. To add a new floor, click Add => Floor. To add a new plan, select the floor you want to add the plan to and click Add => Plan or Add => Street map, if you want to import a map from one of the online map services or Microsoft MapPoint (MapPoint Europe or MapPoint North America are required to use MapPoint maps). To move a plan and related surveys to a newly created floor, simply select the plan with the mouse and drag it to the corresponding floor node. You can also use the context menu commands to Rename or Delete floors and floor plans.
- Include, exclude, or delete surveys: Every survey that you performed shows up as a separate check-boxed item under the floor plan where the survey took place. Checking the box makes the application include the data collected in the course of the selected survey in data analysis and visualizations. Depending on where and when the surveys were conducted, you may want to check all or only some of the survey check boxes. For example, if you have a large site and you made one break while conducting the site survey, your walkabout path will consist of two parts, both of which should be included in the analysis. In a different scenario (e.g., when you surveyed the entire site prior to installing additional wireless hardware and then surveyed it again after the installation), you will probably want to include only one of the surveys and then compare it with the other one by changing the checkbox selection. You can also use the context menu commands to Rename or Delete surveys.
- Merge surveys: Sometimes, you may want to merge several surveys into a single one for clarity and/or convenience. Typically, this might be desirable when you made a break and then resumed the survey from where you previously stopped. In such a situation, it is quite logical to merge two surveys into a single one, as they represent a single logical walkabout path. To do that, check the surveys you want to merge and use the Merge Surveys context menu command. Please note that that the types of the surveys to be merged, their data collection methods, and all other parameters must be exactly the same. For example, you can merge two active surveys conducted in continuous mode in which you collected TCP and UDP throughput data, but you cannot merge an active and a passive survey, or two active surveys if in one of them you collected TCP data and in the other you collected TCP and UDP data. Similarly, you cannot merge two surveys if one of them was conducted in continuous mode while the other was conducted in point-to-point mode.
The Type column displays the type of survey that was conducted: Passive, Active, or Passive + Active. You can use the Comments column to add or modify comments for surveys. The Floor Manager is a tool that may be used in multi-floor predictive models; more information can be found in the Working with Multi-Floor Sites chapter.
Properties
Using this tab, you can configure the project properties. It includes the following panels: Plan / Map, Environment, Client Capabilities, Requirements, and Scanner. You can collapse or expand panels by clicking on the arrow button on the right-hand side of the panel.
Plan / Map
The Plan / Map panel can be used for editing the floor plan Map name, adding Description/Comments to the plan, and adjusting the image brightness and contrast, if the floor plan is too bright, too dark, or lacks contrast. If the floor plan image is colored, you may want to check the Discard color information box to convert it to grayscale, as grayscale images give you a clearer picture when overlaid with data visualizations.
Environment
The Environment panel allows you to configure some of the very important project parameters that affect the way data visualizations are computed.
Because different environments have different characteristics in terms of signal attenuation, diffraction, reflection, etc., you are asked to Select an environment from the list. You should select the environment that best describes the site being surveyed.
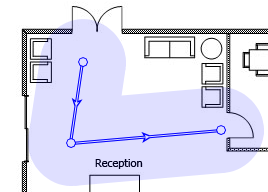
For each environment, the application recommends a Guess range. A guess range is the diameter of the circle for which the application predicts WLAN characteristics with a high degree of certainty. The lower the range, the more accurate the measurements, but the longer your walkabout path is. The higher the range, the less accurate the measurements, but the less time you spend performing a survey. When you conduct a site survey and click on the map to mark your location, TamoGraph displays your path and draws the guess range around the route points and your path, thus giving you a visual indication of the zone that you covered with your survey. The image below illustrates the walkabout path and guess range zone drawn along the path.
It is quite all right to decrease the suggested guess range, but increasing it is not recommended for the reasons explained above.
For passive surveys, TamoGraph can also compute WLAN characteristics outside the guess range zone, although such computations will have a lower degree of accuracy. Check the Extrapolate data beyond the guess range box to enable such computations. Enabling this option will mean that data visualizations will cover the entire map rather than the areas that you actually surveyed. Enabling this option is not recommended.
The Apply power spectral density (PSD) correction in the 6 GHz band checkbox, as the name suggests, is applicable only to 802.11ax/be APs that work in the 6 GHz band. Such APs operate within the power limitations set by the FCC in the USA and similar regulatory bodies in other countries. Essentially, the limitation is that the transmit power depends on the channel width: the wider the channel, the more transmit power can be used. This constitutes a problem for passive surveys in which TamoGraph normally relies on the signal strength of the received beacons and probe responses. Because beacons and probe responses are transmitted using the narrowest possible channel width (i.e., 20 MHz), their RSSI could be lower than the RSSI of the actual data packets. However, this is true only for some classes of 6 GHz APs, such as Low Power Indoor (LPI) APs and Very Low Power (VLP) APs. Standard Power (SP) APs reach the highest power spectral density at 20 MHz, so no correction is needed for SP APs. For a more detailed explanation, please read the online resources here and here.
Therefore, to account for the difference between the signal strength observed in the beacons and the signal strength of the data packets, TamoGraph automatically detects the AP class in the captured beacons and applies the PSD correction to the APs for which such correction is required. However, as a back-up in the situations where the manufacturer did not include the AP class info into the beacons or where the AP classes are sustainably different from the US FCC-defined classes, you may want to use this option. When this option is off, TamoGraph applies the PSD correction based on the AP class detected in the beacons, i.e. the correction is applied to LPI and VLP APs (or similar non-FCC AP classes). When this option is on, TamoGraph applies the PSD correction to all the observed 6 GHz APs.
For predictive models, you can specify the expected noise level for your virtual environment. There are two separate controls for each band 2.4 GHz, 5 GHz and 6 GHz bands. The default level is -90 dBm for 2.4 GHz and -95 dBm for 5 GHz and 6 GHz.
Finally, the Measurement units control can be used to choose the preferred units (feet or meters) for displaying distances and coordinates throughout the application.
Client Capabilities
The PHY rate used in the AP-client connection is determined by the capabilities of the AP and the capabilities of the client. For example, an 802.11ac AP that supports three spatial streams and 80 MHz channels can provide data rates up to 1,300 Mbps. However, if the client is limited to 802.11n, two spatial streams, and 40 MHz channels, the PHY rate will not exceed 300 Mbps.
Using the Client Capabilities panel, you can simulate different types of clients, and this affects the Expected PHY Rate and Requirements visualizations. You can select the Supported standards (802.11 a/b/g/n/ac/ax/be), Channel width (20, 40, 80, 160, or 320 MHz), and Spatial streams (between 1 and 4). By default, client capabilities are set to the best real-world values: 802.11 a/b/g/n/ac, 80 MHz channel width, and three spatial streams. While the 802.11ac standard allows up to eight spatial streams and up to 160 MHz channel width, such clients currently do not exist. If you want to visualize the Expected PHY Rate constrained by the client capabilities, you can do so by adjusting them.
The Signal correction fields can be used to simulate clients that have radios that are much more or much less sensitive than average. Setting a negative value simulates a client that has a “weak” radio, i.e. bad reception. Setting a positive value simulates a client that has a “strong” radio, i.e. good reception. The correction affects all visualizations applicable to passive surveys. Normally, you should not change the default zero values unless you are a very experienced user and know exactly what you are doing.
The Preset field allows you to create several frequently used client configurations and switch between them effortlessly.
Note that the client capabilities configured in this pane affect only passive surveys and predictive models; they do not affect active surveys, because in an active survey, PHY rates depend on the actual client adapter that you use.
Requirements (Design Criteria)
Using the Requirements panel, you can configure the requirements that your WLAN should meet. The configuration that you create will be used for displaying the Requirements (passive surveys) and Requirements (active surveys) visualizations. These visualizations are helpful for a quick and easy evaluation of the overall health of your WLAN and detection of potential issues.
In the Requirements (Design Criteria) table, criteria are configured per metric using the following columns:
- Metric – The WLAN parameter to evaluate (for example, Min. signal level).
- Threshold – The limit that must be met (for example, –67 dBm or 50 ms).
- Required % – The minimum percentage of the target area that must meet the Threshold for this metric to be considered acceptable.
You can set thresholds for the following WLAN parameters (click on the links for the detailed description of the corresponding items):
Passive Surveys and Predictive Models
- Minimum signal level
- Minimum signal-to-noise ratio
- Minimum signal-to-interference ratio
- Minimum APs required
- Minimum PHY rate
- Minimum allowed frame format
- Minimum channel bandwidth
Active Surveys
- Minimum TCP upstream rate
- Minimum TCP downstream rate
- Minimum UDP upstream rate
- Minimum UDP downstream rate
- Minimum actual PHY rate
- Maximum round-trip time
Requirement Presets
To facilitate requirements configuration, three presets are available: Basic (for basic, low throughput connectivity), Medium, and Advanced (for high throughput, redundant connectivity, e.g., for VoIP). You can select a preset from the drop-down list, adjust the values, or create your own by clicking on the New button, typing a preset name, and then clicking the Save button. You can also delete presets by clicking on the Delete button.
In addition to Thresholds, you can set Required %, which defines the acceptance rule for each metric: the minimum percentage of the target area that must meet the Threshold. To speed up setup, use the Default % field located under the Required % column header; entering a value there applies the same Required % to all metrics in the list. You can still set an individual Required % for any metric by editing the value in its row. The Required % value is then used to determine Acceptance (Pass/Fail) by comparing it to the calculated Compliance %.
Requirements Compliance
Using the Requirement Compliance panel, you can see the percentage of the area where your requirements (design criteria) are met. To see the data, you must first select the Requirements (Passive Surveys) or Requirements (Active Surveys) visualization from the Visualizations drop-down list on the application toolbar. The Compliance Percentage column then displays values for each metric (e.g., Signal-to-Interference Ratio). If this percentage is below the user-defined required percentage discussed above, the corresponding metric is marked as Fail; otherwise, it is marked Pass. This report is automatically included in reports whenever you include the Requirements visualization.
The Requirement Compliance section displays the results of evaluating your current survey data or predictive model against the configured Requirements (Design Criteria). To see the data, you must first select the Requirements (Passive Surveys) or Requirements (Active Surveys) visualization from the Visualizations drop-down list on the application toolbar.
The table includes:
- Metric – the evaluated criterion.
- Compliance % – the percentage of the area that meets the Threshold.
- Acceptance – Pass or Fail, based on whether Compliance % meets the configured Required %.
If Required % is not specified for a metric, Acceptance is shown as Not set.
What Area is Used for Compliance Calculations
The Required % value defines the acceptance rule (input) for each metric. The Compliance % value is calculated (output) based on the area being evaluated:
- If you defined a Coverage Area (or a Coverage+Deployment Area) on the map, TamoGraph calculates Compliance % for that defined area only. This allows you to evaluate Requirements for a selected part of the site (for example, only specific rooms).
- If no Coverage Area is defined, TamoGraph calculates Compliance % for the entire surveyed (measured) area. The surveyed area depends on the Consider area covered if signal level is above setting.
The Requirement Compliance summary is included in reports whenever you include the Requirements visualization.
Scanner
The Scanner panel gives you access to the Wi-Fi scanner configuration. The application scanner sweeps through the channels supported by the wireless adapter to collect and analyze packets being sent on the selected channels. It is not recommended that you modify the default 250 ms per channel scan interval. As for the list of channels to be scanned, you may want to modify it if you know that some of the channels supported by the wireless adapter are not used in your WLAN. For example, if your WLAN does not use the 5 GHz band, you may want to turn off all 5 GHz channels; this will shorten the scanning cycle and, therefore, increase the data accuracy. However, please keep in mind that skipping some of the channels may result in the application's inability to detect sources of interference, such as neighboring APs that work on the channels that were skipped. If you uncheck the Use the same interval for all channels box, you will be able to specify individual per-channel intervals. It is recommended that you leave this box checked. You can use the Select channels button for selecting or deselecting all channels, as well as for selecting channels based on the country- or region-specific allowed channel lists (e.g., choosing United States will select channels 1-11 and deselect channels 12-14 in the 2.4 GHz frequency band). The Scanner panel can be used only if you have a compatible adapter for passive surveys.
Options
This tab allows you to configure the application options. It includes the following panels: Colors and Value Ranges, AP Detection and Placement, Visualization Settings, Tips, Computations, and Miscellaneous. You can collapse or expand panels by clicking on the arrow button on the right-hand side of the panel.
Colors and Value Ranges
Using this tab, you can configure color schemes, drawing styles, and value ranges used in visualizations overlaid on top of the floor plan or site map. Use the Survey path color selection boxes to choose the colors to be used for drawing active and inactive paths. An active path is the path along which you are currently walking, marking your location on the map. Inactive paths are the paths from previously performed surveys.
You can also choose between several Visualization schemes that will be used for visualizations, such as signal level or expected PHY rate. Checking the Smooth colors box makes the transition between colors smooth. Checking the Invert colors box inverts the colors in the selected visualization scheme. If you would like to see the contours between areas of different color, check the Contour box.
Using the Value Ranges section, you can configure the range of values represented by the selected color scheme for the Signal Level, Signal-to-Noise Ratio, Signal-to-Interference Ratio, Number of APs, Expected PHY Rate, Actual PHY Rate, TCP Upstream and Downstream Rate, UDP Upstream and Downstream Rate, and Round-trip Time visualizations. For example, if you selected the color scheme that ranges from red to blue and a signal level value range from -80 dBm to -30 dBm, any area where the signal level is equal to or below -80 dBm will be shown in red, and any area where the signal level is equal to or above -30 dBm will be shown in blue. Additionally, you can adjust the Steps value (i.e., the number of distinct colors to be used). Using the same example, the entire value range from -80 to -30 dBm would be 50 dBm; setting the Steps value to 10 would mean that every 5 dBm, a new color would be used to display the signal level and the total number of distinct colors zones would be 10. Setting the Steps value to 20 would double the number of distinct colors, making the color overlay much smoother.
Click the Reset button below the value ranges to revert to the default range settings.
AP Detection and Placement
This tab allows you to configure some of the options that control how TamoGraph detects APs and shows them on the map.
Ignore APs if max. signal is below – Checking this box prevents the application from detecting and processing signals from very weak APs. Typically, such APs do not affect your WLAN and cannot provide connectivity due to weak signal. The default cut-off level is -90 dBm; if the signal from an AP never exceeds the specified level, TamoGraph will completely ignore it.
Mark estimated AP locations – Checking this box makes the application automatically place APs on the map once the survey has been performed. If the estimated AP location is not accurate, you can correct it by moving the AP icon on the map with the mouse. If you corrected the AP location(s) by moving the corresponding icon(s), you can revert to the original location by right-clicking on the AP list on the left panel and then clicking Auto-locate Access Points (this action can be applied to All or Selected APs; here by Selected we mean the AP that is currently highlighted in the AP list).
Don't auto-place APs if max. signal is below – Checking this box prevents the application from trying to determine the location of those APs for which a strong signal was not detected. TamoGraph automatically determines the position of APs with strong signals and marks them on the map (if the previous option is enabled). If the signal is not strong enough, such AP placement may not be accurate: The AP might be located outside the site map and might not belong to your WLAN. The default cut-off level is -75 dBm; if the signal from an AP never exceeds the specified level, TamoGraph will not try to mark its position on the map. If the AP was not placed on the map, you can do it yourself by dragging the corresponding AP icon from the left-side AP list and dropping it on the map.
Maximum number of APs in tooltips – When a mouse hovers over survey path turning points, a tooltip is displayed. The tooltip contains the list of the strongest APs audible in the selected point. Use this control to limit the number of APs shown on the list.
Visualization Settings
The following settings affect the way TamoGraph displays some visualizations:
Area is considered covered if signal strength is at least – This setting defines the AP coverage area based on the minimum signal strength. If the signal strength is below the specified level, the area is considered to be not covered, which means that some data values will not be computed for the area (such areas will appear as white spots). The definition of “strong enough” is rather subjective because certain signal strength might be sufficient for low data rates, but insufficient for the high data rates required for such applications as VoIP. Additionally, 802.11 adapters vary in sensitivity, and some adapters might be able to provide good connectivity in zones where other adapters fail to connect altogether. The default value is -70 dBm. By default, this setting is applicable to the following visualizations: Signal-to-Interference Ratio, AP Coverage Areas, Number of APs, Frame Format, and Channel Bandwidth. Optionally, you can make it applicable to the Signal Level visualization by checking the Also applicable to Signal Level visualization checkbox.
Average network utilization – This setting defines how heavy the interference is from the interfering APs. If the interfering signal strength is high, but the network utilization is low, the interfering AP does not create much interference. A typical office WLAN has a network utilization of between 10% and 25%. Adjust this setting to match the actual value for your WLAN. This setting is applicable to the following visualization: Signal-to-Interference Ratio.
AP coverage areas – This setting allows you to change the color coding method used for displaying coverage areas. In No fill, contours only mode, the application draws contours of the coverage areas without filling the areas with colors. In Fill and mix colors mode, the AP coverage areas are filled with colors; when areas overlap, the application draws a striped pattern, alternating the colors of the respective APs. In Fill, the strongest AP on top mode, AP coverage areas are filled with colors; when areas overlap, the application draws the color of the strongest AP. In Fill, the weakest AP on top mode, AP coverage areas are filled with colors; when areas overlap, the application draws the color of the weakest AP. This setting is applicable to the following visualization: AP Coverage Areas.
Grayscale obstructions – This setting controls whether virtual objects (used in predictive models) are displayed in color or grayscale mode. Available options are Always, When applying visualizations, and Never.
How AP icon locations affect signal – This setting controls the effect that the AP icons have on the calculations of the signal level and other visualizations. The following three options are available:
- Estimated AP locations do not affect signal levels; they are icons only – Suitable for the surveys where signal levels are low and AP locations cannot be estimated accurately. In this mode, the application displays data based ONLY on the actual measurements; there are no extrapolations.
- Estimated AP locations are used to complement measured signals (new algorithm) –Recommended for most surveys. It uses a new, more realistic algorithm for computing signal propagation. This is the default option.
- Estimated AP locations are used to complement measured signals (old algorithm, up to version 4.1) – The old-style algorithm used in versions prior to 4.2. The result is typically overly optimistic.
Tips Panel
The tips panel is a small panel that is shown at the bottom of the application window; it displays useful tips and tricks that help you perform certain tasks. You can control whether to show tips when Conducting Surveys and performing RF Planning and Selecting multiple obstruction objects by checking or unchecking the corresponding checkboxes. Experienced users may want to turn off tips altogether to free more space for the floor plan. By default, all tips are enabled.
Computations
The following settings affect the way TamoGraph performs heavy computational tasks needed for predictive RF models:
Use GPU for faster computations – Check this box if you want TamoGraph to use the computational resources of your graphics processing unit (also known as “video card”). If your computer is equipped with a modern, fast GPU (preferably a discrete, dedicated one), selecting this option will make computations of complex RF models much faster. Note that this option is disabled if your GPU is not supported or if you are running a 32-bit TamoGraph version.
Allow background computations – This option is turned off by default. Check this box if you want TamoGraph to conduct computations in the background. For example, if this option is turned on, once you have opened a project with a predictive model, TamoGraph will start computing the model before you select any visualization. These saves time when you actually select a visualization to work with the model. Please turn on this option only if you running TamoGraph on a very powerful computer to ensure that other tasks are not slowed down due to the background computations.
Miscellaneous
The following miscellaneous options are available:
Use voice assistance during survey – Check this box if you want TamoGraph to use the operating system’s text-to-speech engine to pronounce hints and warnings while you perform a survey. This option is available only if the current program interface is set to English. The drop-down list below this box allows you to select one of the available voices.
Load last opened project at startup – Check this box if you want TamoGraph to automatically load the last project you worked on (if any) when the application starts.
Autosave project after survey – Check this box if you want to automatically save projects every time the survey is completed ensuring that the latest data is added to the project.
Autosave a project backup – Check this box if you want to save a separate backup copy of the project whenever potentially risky or time-consuming operations are performed on the open project. You can specify the location for saving these backup copies and define how many of the most recent copies should be kept. Set the value to “0” for an unlimited number of copies. Note: this function is disabled by default.
Display scanner progress on the taskbar – Check this box if you want TamoGraph to animate the Windows taskbar button while you perform a survey. Not available in macOS.
Use AP names from Cisco Aironet extensions – Check this box if you want TamoGraph to use Cisco CCX to assign names to Cisco APs. This box also enables similar functionality when displaying Aruba APs.
Custom AP names are used globally – Check this box if you want TamoGraph to use custom AP names throughout all the projects that you work with on a given computer. When this box is not checked, custom AP names are project-specific.
Show AP labels on the map – Check this box if you want TamoGraph to display a small label with the AP name next to each AP on the floor plan.
Ignore multitouch features – Check this box if you want TamoGraph to ignore the fact that you are running it on a computer with a multitouch display. When TamoGraph detects a multitouch display, it makes certain changes to the interface elements to make them more convenient to use. For example, pane splitters become wider, the circles that represent walkabout points become larger, and so on. If you do not need these changes, you can use this option to force TamoGraph to use a standard user interface. Enabling or disabling this option requires a restart. Not available in macOS.
Smart map scrolling – Select when you want TamoGraph to use smart map scrolling: Always, During Survey, or never, if you uncheck this box. Smart map scrolls the map automatically whenever you click or tap next to the map edge, eliminating the need to scroll the map as you move along your path.
Enable automatic updates – Check this box if you want TamoGraph to connect to the TamoSoft and see whether a new TamoGraph version is available. When this option is enabled, TamoGraph checks for updates once a week.