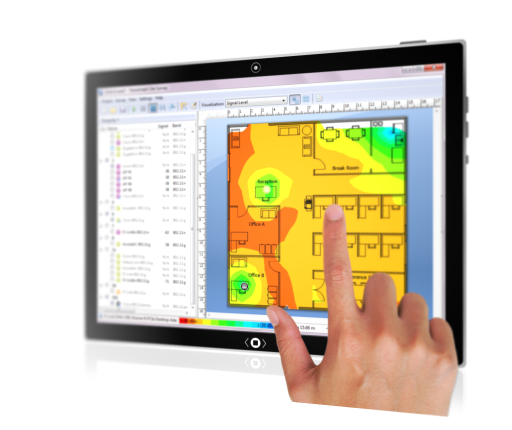
Welcome to TamoGraph Site Survey, a powerful and user-friendly
application for collecting and visualizing Wi-Fi data. Wireless
network deployment and maintenance requires the use of a
professional RF site survey tool that facilitates otherwise
time-consuming and very complex tasks, rates, etc. By using
TamoGraph, businesses can dramatically reduce the time and costs
involved in deploying and maintaining WLANs and improve network
performance and coverage.
Why to Perform a Site Survey
In a word, wireless site surveys are necessary because radio wave
propagation is difficult to predict, especially in non-open space
environments. Considering all the variables that might affect the
health and performance of your WLAN is virtually impossible.
Changing conditions, even something as seemingly minor as a laptop
equipped with a legacy 802.11g adapter that your new employee
connected to the office wireless network, might seriously affect
the WLAN performance. In addition, considering the wide
proliferation of wireless infrastructure, factors such as
interference from nearby WLANs play a very important role. This is
why regular site surveys conducted with a professional tool are
essential.
When to Perform a Site Survey
Pre-deployment surveys:
At this stage, a site survey is necessary in order to verify that
the network plan works well in a real-world environment. Placement
of temporary access points (APs) and a quick survey of the
resulting WLAN characteristics allow an engineer to fine-tune AP
and antennae placement, determine the optimal number and types of
APs and antennae, and avoid poor coverage zones. Using TamoGraph,
you can also perform a simulation in a virtual environment prior to
deployment.
Post-deployment surveys:
Once a WLAN has been deployed, a complete verification site survey
is necessary to ensure that the WLAN performance and coverage meet
the design requirements. At this stage, the Wi-Fi equipment
placement is finalized, and a site survey report should be
generated so that the historical records can be accessed at any
time in the future.
Regular, ongoing surveys:
Maintaining high performance and coverage requires regular
“check-up” surveys. New users, new equipment, site expansion,
neighboring WLANs, and other factors can adversely affect your
WLAN. It should be monitored on a regular basis.
Survey Types
There are three types of surveys that you can conduct with
TamoGraph: passive, active,
and predictive (the
latter is technically not a survey; rather, it’s virtual modeling).
During a passive
survey,
the application collects the most comprehensive data on the RF
environment: information on access points and their
characteristics, signal strength, noise level, interference, etc.
This is the default and most important survey type that we
recommend to conduct in every case. It is called passive because
during this type of survey, the application passively listens for
packets and does not attempt to connect to WLANs. However, to
provide more insight into the real-world performance of your WLAN,
TamoGraph can also perform active
surveys,
during which your Wi-Fi adapter connects to the wireless network(s)
of your choice to measure actual throughput rates and a few other
metrics. Unlike passive and active
surveys, predictive
modeling is
not performed on-site. Predictive models are a computer simulation
in which Wi-Fi characteristics are predicted for the virtual
environment model created by the user. The process of creating and
adjusting the virtual environment, selection and placement of
simulated APs, and analyzing the resulting WLAN is commonly
referred to as “RF planning”, “RF predictive modeling,” or “RF
modeling.” Please
refer to the Understanding Survey Types: Passive, Active, and
Predictive chapter
for more information on this topic. Additionally,
TamoGraph can be used to perform spectrum analysis surveys.
|