
Explore Spectrum Activity in More Detail
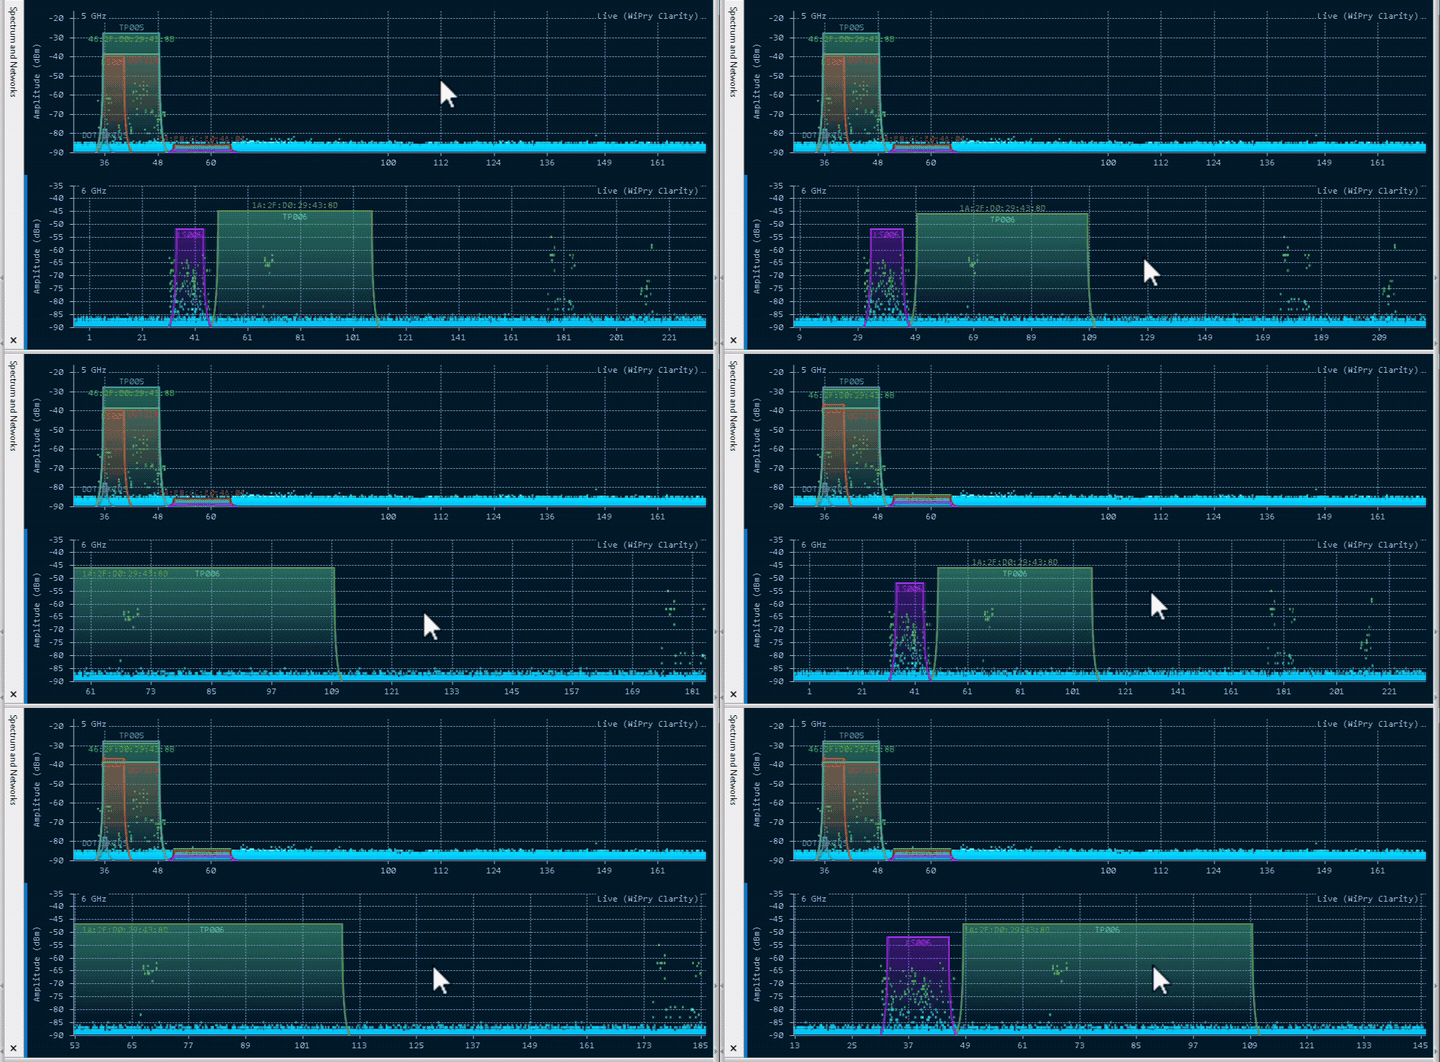
Finding activity in a specific part of a wide frequency band is now much easier.
You can:
- Zoom in and out of the spectrum view.
- Pan to the frequency range you want to inspect.
- Quickly reset the view.
- Save the current spectrum view as a PNG image.
Zoom and navigation are available using the mouse, arrow keys, or context menu.
Keep Virtual Objects Organized
Working with maps that contain many walls, attenuation areas, access points, or other virtual objects is now faster and safer.
The new Virtual Objects tab gives you quick access to the controls you use most often:
- Hide objects you don’t currently need to reduce visual clutter.
- Lock completed objects to prevent accidental movement or reshaping.
- Select all objects of one type with a single action.
- Control which object types can be selected using area selection.
You can also apply visibility, locking, and selection settings to all object types at once.
View Coverage at the Height That Matters
Predicted Wi-Fi coverage is no longer limited to a visualization plane 1 m above the floor.
You can now choose the visualization height separately for each map and view predicted coverage at the level relevant to your environment.
This is particularly useful when analyzing:
- Warehouses with devices mounted at different heights
- Multi-level or high-ceiling spaces
- Environments where users or equipment operate above or below the previous 1 m plane
Reports automatically use the visualization height selected for each map.
Make Project Backups Easier to Find
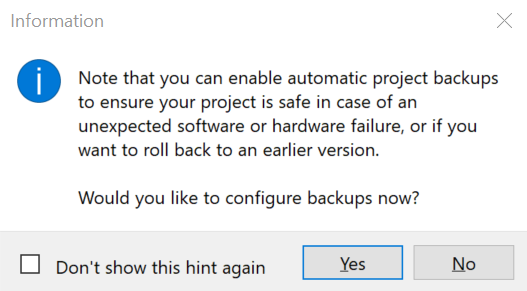
TamoGraph can now remind you where to configure automatic project backups.
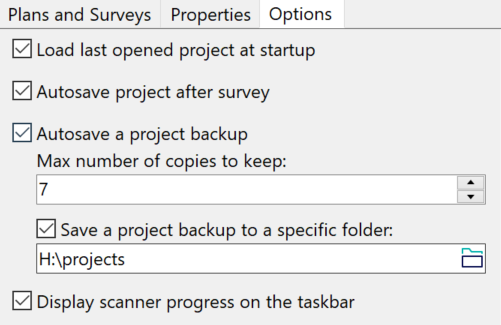
After the first project save following installation, a one-time prompt can take you directly to the backup settings, where you can:
- Enable automatic backups.
- Choose how many previous versions to keep.
- Select the backup folder.
Nothing is enabled or changed automatically—you remain in control of your backup settings.
Smoother Scanning With Netgear A9000 Adapters
TamoGraph 8.5 addresses an issue that could make the interface less responsive during scanning with Netgear A9000 adapters.
More Control for Advanced Passive Scanning
Advanced users can now disable probe requests during passive scanning when required.
The new PassiveSilentMode option allows scanning without sending probe requests. Probe requests can help discover access points in some environments, but they are not required for passive scanning.
Fine-Tune GPU Acceleration
Advanced users can now adjust GPU load and data block size. On affected GPU models, fine-tuning these settings may improve stability and help prevent freezes or crashes.
TamoGraph 8.5
Upgrade to TamoGraph 8.5
Get a clearer view of spectrum activity, spend less time managing complex maps, and analyze predicted coverage at the height that matters for your environment.