Using the Program
The program interface consists of five tabs that allow you to view data and perform various actions with captured packets. To start capturing packets, select a network adapter from the drop-down list on the toolbar, and click on the Start Capture button or select File = > Start Capture from the menu. If network traffic passes through the selected adapter, CommView will start displaying information.
Main Menu
File
- Start/Stop Capture – starts/stops capturing packets.
- Suspend/Resume Packet Output – stops/resumes the real-time packet output on the 2nd tab.
- Remote Monitoring Mode – shows/hide the remote monitoring toolbar.
- Save Latest IP Connections As – allows you to save the contents of the Latest IP Connections tab as an HTML or a comma-delimited (CSV) report.
- Save Packet Log As – allows you to save the contents of the Packets tab in different formats. Use the Logging tab for advanced saving options.
- Log Viewer – opens a new Log Viewer window.
- VoIP Log Viewer – opens a new VoIP Log Viewer window.
- Clear Latest IP Connections – clears the Latest IP Connections table (1st tab).
- Clear Packet Buffer – clears the contents of the program's buffer and the packet list (2nd tab).
- Clear VoIP Data – clears the contents of the VoIP tab.
- Performance Data – displays the program's performance statistics: the number of packets captured and dropped by the device driver.
- Exit – closes the program.
Search
- Find Packet – shows a dialog that allows you to find packets matching a specific text.
- Go to Packet Number - shows a dialog that allows you to jump to a packet with the specified number.
View
- Statistics – shows a window with data transfer and protocol distribution statistics.
- Port Reference – shows a window with port reference information.
- Log Directory – opens the directory to which logs are saved by default.
- Latest IP Connections Columns – shows/hides the Latest IP Connections tab columns.
- Packets Columns – shows/hides the Packets tab columns.
Tools
- Packet Generator – opens the Packet Generator window.
- Reconstruct TCP Session – allows you to reconstruct a TCP session starting from the selected packet; it opens a window that displays the entire conversation between two hosts.
- Reconstruct UDP Stream – allows you to reconstruct a UDP stream starting from the selected packet; it opens a window that displays the entire conversation between two hosts.
- NIC Vendor Identifier – opens a window where you can identify a network adapter vendor by MAC address.
- Scheduler – allows you to add or remove scheduled capturing tasks.
Settings
- Fonts – shows the submenu for setting the fonts of the interface elements.
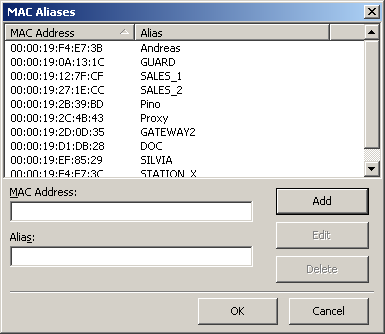
- MAC Aliases – brings up a window where you can assign easy-to-remember aliases to MAC addresses.
- IP Aliases – brings up a window where you can assign easy-to-remember aliases to IP addresses.
- Options – brings up the Options window where additional advanced program options can be set.
- Language – allows you to change the interface language. Be sure to restart the program once you've changed the language. The CommView installation package may not include all available language files for the interface. Clicking on the Other Languages menu item opens the additional languages download page on our Website where you can download your language file if it is available for the current version.
- Install Dial-up Driver – installs a driver for capturing packets on dial-up adapters. This item is invisible if the driver has been installed.
- Install Token Ring Driver – installs a driver for capturing packets on Token Ring adapters. This item is invisible if the driver has been installed.
Rules
- Save Current Rules As – allows you to save current rules configuration to a file.
- Load Rules From – allows you to load a previously saved rules configuration from a file.
- Reset All – clears all existing rules (if any).
Help
- Contents – launches CommView help.
- Search For Help On … – shows CommView help index.
- Online Tutorial – launches a browser window and opens the CommView online tutorial.
- Check for an Update on the Web – opens the update wizard. Please follow the instructions on the screen to download and install the latest upgrade for CommView from the TamoSoft Website.
- Activation – allows you to activate your software license or check the current activation status.
- About – shows information about the program.
Almost every element of the interface has a context-sensitive menu that can be invoked by clicking on the right mouse button, and many commands are available only through these menus.
The first tab is used for displaying detailed information about your computer's network connections (IP protocol only). For more information see Latest IP Connections.
The second tab is used for viewing captured network packets and displaying detailed information about a selected packet. For more information see Packets.
The third tab allows you to save captured packets to files. For more information see Logging.
The fourth tab is for configuring rules that allow you to capture/ignore packets based on various criteria, such as IP address or port number. For more information see Rules.
The fifth tab allows you to create alarms that can notify you about important events, such as suspicious packets, high bandwidth utilization, unknown addresses, etc. For more information see Alarms.
The sixth tab allows you to work with the VoIP analysis module. Note that this tab is only available to VoIP license users or evaluation version users who selected VoIP evaluation mode.
You can change some of the settings, such as fonts, colors, and buffer size by selecting Settings from the menu. For more information see Setting Options.
Selecting Network Interface for Monitoring
Monitoring your network connection begins with selecting the network interface that you will monitor. Selecting the correct network interface for monitoring is crucial for achieving the desired monitoring results. We tried to make CommView as simple and user-friendly as possible, all you need to do to start monitoring your network is select an adapter in the drop-down list in the toolbar and click on the Start Capture button.
As network technologies develop, more and more different adapter types become available in the market. WiFi adapters, xDSL, you name them. CommView supports many of them; however, each type of network connection has its own peculiarities that you need to know in order to obtain proper monitoring results.
Let us walk through the list of the most common types of network adapters and see how CommView operates with them and how it should be configured.
During installation, CommView detects the network adapters available in your system. At some point, the installation script will prompt you to install the driver for your dial-up adapter. You need to click Yes if you plan to monitor your dial-up network or your xDSL connection, or use PPPoE/VPN over other types of network connections. If you say No at this point, you can always install the dial-up adapter driver later on by clicking Settings => Install Dial-up Driver. During the dial-up driver installation your network links will be brought down for a moment.
Once the installation is completed, launch CommView and click on the drop-down list in the toolbar. You will see the Loopback adapter, your Local Network adapter (if you have one), and your dial-up adapter (if you clicked Yes when prompted to install dial-up driver).
Let's see how these entries correspond to the actual hardware in your computer and the network connection types.
If you are connected to the network via an ordinary Ethernet adapter, just select it from the drop-down list and start monitoring. CommView supports virtually any 10, 100, or 1000 Mbit Ethernet adapter available on the market.
If you dial up via modem to connect to the network, select your dial-up adapter for monitoring. Please note that you will only see incoming and outgoing packets (and no pass-through packets) in CommView. This is not a limitation of CommView. Such is the nature of any point-to-point connection; only two hosts, the local and the remote participate in the connection. If you use ICS, you will capture all packets to and from the ICS clients.
When using CommView for monitoring wireless 802.11 a/b/g/n/ac networks, select your Wi-Fi adapter for monitoring. General purpose drivers cannot put Wi-Fi adapters in promiscuous mode; CommView will show incoming and outgoing packets, as well as multicast and broadcast packets. 802.11 packet headers will not be displayed. If you are looking for a promiscuous mode monitoring solution for Wi-Fi networks, consider CommView for WiFi that actually puts your wireless adapter into monitoring mode and allows you to capture traffic from other wireless stations and APs. CommView for WiFi can be downloaded from the TamoSoft Website.
If your network connection is via an xDSL modem with USB interface, you may be able to monitor it with CommView. Officially, we do not support USB interfaces in CommView, so the best thing is to try. In many cases the actual network connection will be established over PPPoE link, in which case you will need to select the dial-up adapter for monitoring and will be able to capture the network traffic.
If your xDSL modem has Ethernet interface, but the actual connection is made over PPPoE link, select the dial-up adapter for monitoring the network traffic to/from your computer, and broadcast/multicast packets. If you select your Ethernet adapter for monitoring, you will be able to capture all packets on the LAN segment, however they will be PPPoE encapsulated and may be encrypted.
If you are connected to the network via a secure VPN link, monitoring your Ethernet network adapter will only allow you to capture encrypted packets. In this case you need to monitor the dial-up adapter to capture the actual data being transmitted.
If you have two or more network adapters in your computer that are Bridged, monitoring the Bridge will show incoming and outgoing traffic for each adapter in the Bridge, broadcast and multicast packets, and the packets being redirected to another bridged network adapter.
Monitoring Loopback adapter will show you the local traffic sent or received over TCP/IP by the programs running on your computer. If you do not have any programs running that exchange data locally, you won't see any traffic when monitoring Loopback adapter. Please note that the Packet Generator function will not work with the Loopback adapter. For more information please see the Capturing Loopback Traffic chapter.
In addition to physical and virtual network adapters, the latest CommView version allows for selecting a virtual adapter for capturing decrypted SSL traffic. These SSL virtual adapters are overviewed in the Capturing Decrypted SSL Traffic chapter.
Latest IP Connections
This tab is used for displaying detailed information about your computer's network connections (IP and IPv6 protocols only). To start capturing packets, select File = > Start Capture in the menu, or click on the corresponding button on the toolbar.
The meaning of the table columns is explained below:
- Local IP – shows the local IP address. For inbound packets, it is the destination IP address; for outbound and pass-through packets, it is the source IP address.
- Remote IP – shows the remote IP address. For inbound packets, it is the source IP address; for outbound and pass-through packets, it is the destination IP address.
- The program automatically determines the location of any IP address, and depending on your geolocation settings, may show the country name or flag next to the IP address. For more information see Setting Options.
- In – shows the number of packets received.
- Out – shows the number of packets sent.
- Direction – shows the session direction. The direction is determined based on the direction of the first packet received from or sent to the remote IP address.
- Sessions – shows the number of established TCP/IP sessions. If no TCP connections were established (connections failed, or the protocol is UDP/IP or ICMP/IP), this value is zero.
- Ports – lists the remote computer's ports used during the TCP/IP connection or connection attempt. This list can be empty if the protocol is not TCP/IP. Ports can be displayed either as numeric values or as the corresponding service names. For more information see Setting Options.
- Hostname – shows the remote computer's hostname. If the hostname cannot be resolved, this column is empty.
- Bytes – shows the number of bytes transmitted during the session.
- Last packet – shows the time of the last packet sent/received during the session.
- Process – shows the process on your computer that sends or receives packets in the session. Mapping packets to processes only works for incoming and outgoing packets, as CommView cannot be aware of processes running on other computers that send or receive packets. Naturally, there may be several applications on the local computer exchanging data with a remote computer, so the Latest IP Connections tab only shows the latest process that sent or received data for this particular pair of IP addresses. If you would like to map a process to a particular packet, you can see this information in the decoded packet tree in the Packets tab. CommView can display the full path to the process that sent or received packets, check the Display full process path checkbox in Settings => Options, General tab to enable this feature. When working in remote monitoring mode through Remote Agents, this column displays the IP address or the hostname of the Remote Agent from which the packets are being received; no process names will available. Please note that on some operating systems, this column will list process names only after you reboot the computer after the CommView installation.
You can show or hide individual columns by right-clicking on list header or using the View => Latest IP Connections Columns menu. The column order can be changed by dragging the column header to a new location.
Menu Commands
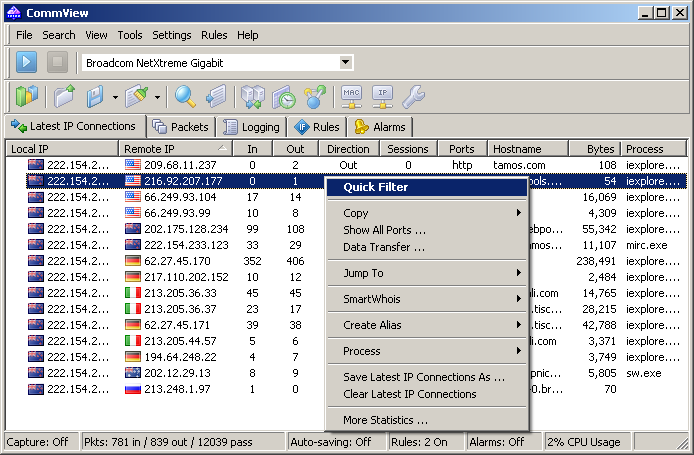
Right-clicking on the Latest IP Connections list brings up a menu with the following commands:
- Quick Filter – finds the packets sent between the selected IP addresses and displays them in a new window. The same action is performed when you double-click on this window.
- Copy – copies the local IP address, remote IP address, or hostname to the clipboard.
- Show All Ports – displays a window with the complete list of ports used in communicating between the selected pair of IP addresses. This is useful when many ports were used, and they don't fit into the corresponding column.
- Data Transfer – displays a window with information on the data transfer volume between the selected pair of IP addresses and the time of the last packet.
- Jump To – allows you to quickly jump to the first/last packet with the selected source/destination IP address; the program will display the Packets tab and set the mouse cursor to the packet that matches the criterion.
- SmartWhois – sends the selected source or destination IP address to SmartWhois, if it is installed on your system. SmartWhois is a stand-alone application developed by our company capable of obtaining information about any IP address or hostname in the world. It automatically provides information associated with an IP address, such as domain, network name, country, state or province, city. The program can be downloaded from our site.
- Create Alias – brings up a window where you can assign an easy-to-remember aliases to the selected IP address.
- Process – allows you to obtain additional information about or perform actions with the process that sends or receives packets in the selected session. You can Terminate a process, see the File Properties dialog, or have the program Show Full Path to process' executable file.
- Save Latest IP Connections As – allows you to save the contents of the Latest IP Connections tab as an HTML or a comma-delimited (CSV) report.
- Clear Latest IP Connections – clears the table.
- More Statistics – shows a window with data transfer and protocol distribution statistics.
Packets
This tab is used for listing all captured network packets and displaying detailed information about a selected packet.
The top table displays the list of captured packets. Use this list for selecting a packet that you want to have displayed and analyzed. When you select a packet by clicking on it, other panes show information about the selected packet.
The meaning of the table columns is explained below:
- No – a unique packet number.
- Protocol – shows the packet's protocol.
- Src MAC, Dest MAC – shows the source and destination MAC addresses.
- Src IP, Dest IP – shows the source and destination IP addresses (where applicable).
- Src Port, Dest Port – shows the source and destination ports (where applicable). Ports can be displayed either as numeric values or as the corresponding service names. For more information, see Setting Options.
- Time / Delta – shows the packet's absolute or delta time. Delta time is the difference between the absolute times of the last two packets. You can switch from absolute to delta time by clicking View =>Packets Columns =>Show Time As.
- Size – shows packet size in bytes. This column is not visible by default.
- More Details – shows a brief packet summary.
You can show or hide individual columns by right-clicking on list header or using the View => Packets Columns menu. The column order can be changed by dragging the column header to a new location.
The packet output can be suspended by clicking File =>Suspend Packet Output. In the Suspended mode, the packets are being captured, but not displayed, on the Packets tab. This mode is useful when you are interested only in the statistics rather than individual packets. To resume real-time packets display, click File =>Resume Packet Output.
The middle pane displays the raw contents of the packet, both in hexadecimal notation and as plain text. In the plain text, non-printable characters are replaced with dots. When multiple packets are selected in the top table, the middle pane displays the total number of selected packets, the total size, and the time span between the first and the last packet.
The bottom pane displays decoded packet information for the selected packet. This information includes vital data that can be used by network professionals. Right-clicking on the pane invokes the context menu that allows you to collapse/expand all the nodes or to copy the selected or all nodes.
The packets tab also includes a small toolbar shown below:
![]()
You can change the position of the decoder window by clicking on one of the three buttons on this toolbar (you can have a bottom-, left-, or right-aligned decoder window). The fourth button makes the packet list auto-scroll to the last packet received. The fifth button keeps the packet you selected in the list visible (i.e. it won't leave the visible area as new packets arrive). The sixth button allows you to open the contents of the current packet buffer in a new window. This functionality is very useful under a heavy network load, when the packet list is rapidly scrolling and it's difficult to examine packets before they move out of the visible area. Clicking on this button creates a snapshot of the buffer so you can comfortably examine it in a separate window. You can make as many snapshots as you wish.
Menu Commands
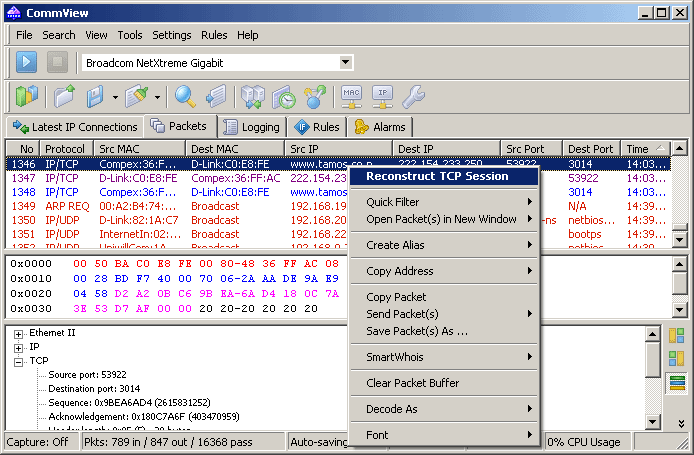
Right-clicking on the packet list brings up a menu with the following commands:
- Reconstruct TCP Session – allows you to reconstruct a TCP session starting from the selected packet; it opens a window that displays the entire conversation between two hosts. The same action is performed when you double-click on this window.
- Quick Filter – finds the packets sent between the selected MAC addresses, IP addresses, or ports and displays them in a new window.
- Open Packet(s) in New Window – allows you to open one or several selected packets in a new window for comfortable examination.
- Create Alias – brings up a window where you can assign an easy-to-remember aliases to the selected MAC or IP address.
- Copy Address – copies the source MAC address, destination MAC address, source IP address, or destination IP address to the clipboard.
- Copy Packet – copies the raw data of the selected packet to the clipboard.
- Send Packet(s) – shows the Packet Generator window that allows you to resend the selected packet or a group of packets. You can also modify the packet contents before sending it.
- Save Packet(s) As – saves the contents of the selected packet(s) to a file. The Save As dialog allows you to select the format to be used when saving data from the drop-down list.
- SmartWhois – sends the source or destination IP address from the selected packet to SmartWhois if it is installed on your system. SmartWhois is a stand-alone application developed by our company capable of obtaining information about any IP address or hostname in the world. It automatically provides information associated with an IP address, such as domain, network name, country, state or province, and city. The program can be downloaded from our site.
- Clear Packet Buffer – clears the contents of the program's buffer. The packet list will be cleared, and you will not be able to view the packets previously captured by the program.
- Decode As – for TCP and UDP packets, allows you to decode supported protocols that use non-standard ports. For example, if your SOCKS server runs on port 333 rather than 1080, you can select a packet that belongs to the SOCKS session and use this menu command to make CommView decode all packets on port 333 as SOCKS packets. Such protocol-port reassignments are not permanent and will last only until the program is closed. Note that you cannot override standard protocol-port pairs, e.g. you cannot make CommView decode packets on port 80 as TELNET packets.
- Font – allows you to increase or decrease the font size used to display packets without affecting the font size of all other interface elements.
You can also drag-and-drop selected packet(s) to the desktop.
Logging
This tab is used for saving captured packets to a file on the disk. CommView saves packets in its own format with the .NCF extension. The old (.CCF) format is supported for backward compatibility; however, you can no longer save the captured packets. You can open and view these files at any time using Log Viewer, or you can just double-click on any NCF or CCF file to have it loaded and decoded.
NCF is an open format; please refer to CommView Log Files Format chapter for detailed NCF format description.
Save and Manage
Use this frame to save the captured packets manually to a file and to concatenate/split capture files.
It is possible either to save all packets currently stored in the buffer or save only a part of them within a given range. The To and From fields allow you to set the necessary range based on the packet numbers as shown on the Packets tab. Click Save As … to select a file name.
To concatenate manually multiple NCF files into a single, larger file, click on the Concatenate Logs button. To split NCF files that are too large into smaller chunks, click on the Split Logs button. Then the program will guide you through the process, and you will be able to enter the desired size of the output files.
Auto-saving
Check this box to have the program automatically save captured packets as they arrive. Use the Maximum directory size field to limit the total size of the capture files stored in the Log Directory. If the total size of the capture files exceeds the limit, the program automatically deletes the oldest files in the directory. The Average Log File Size field allows you to specify the approximate desired size of each log file. When the log file reaches the specified size, a new file is automatically created. To change the default Log Directory, click on the Save files to box and select a different folder.
Please note that the program doesn't save each packet individually immediately upon arrival. It means that if you view the log file in real time, it may not contain the latest packets. To make the program immediately dump the buffer to the log file, click Stop Capture or uncheck the Auto-saving box.
WWW Access Logging
Check this box to enable logging of HTTP sessions. Use the Maximum file size field to limit the size of the log file. If the log file size exceeds the limit, the program automatically deletes the oldest records in the file. To change the default file name and path, click on the Save files to box and select a different file name. Log files can be generated in HTML or TXT formats. Click Configure to change the default logging options. You can change the port number that is used for HTTP access (the default value of 80 might not work for you if you are behind a proxy server), and exclude certain data types (usually logging anything other than HTML pages is quite useless, therefore it is a good idea to exclude URLs of pictures from the log file).
Viewing Logs
Log Viewer is a tool for viewing and exploring capture files created by CommView and several other packet analyzers. It has the functionality of the Packets tab of the main program window, but unlike the Packets tab, Log Viewer displays packets loaded from the files on the disk rather than the packets captured in real time.
To open Log Viewer, click File => Log Viewer in the program's main menu, or just double-click on any CommView capture file that you have previously saved. You can open as many Log Viewer windows as you wish, and each of them can be used for exploring one or several capture files.
Log Viewer can be used for exploring capture files created by other packet analyzers and personal firewalls. The current version can import files in the Network Instruments Observer®, Network General Sniffer® for DOS/Windows, Microsoft® NetMon, WildPackets EtherPeek™ and AiroPeek™, Wireshark/Tcpdump, and Wireshark/pcapng formats. These formats are also used by a number of 3rd-party applications. Log Viewer is capable of exporting packet data by creating files in the Network Instruments Observer®, Network General Sniffer® for DOS/Windows, Microsoft® NetMon, WildPackets EtherPeek™ and AiroPeek™, Wireshark/Tcpdump, and Wireshark/pcapng formats, as well as the native CommView format.
Using Log Viewer is similar to using the Packets tab of the main window; please refer to the Packets chapter if you need detailed information.
Log Viewer Menu
File
- Load CommView Logs – opens and loads one or several CommView capture files.
- Import Logs – allows you to import capture files created by other packet analyzers.
- Export Logs – allows you to export the displayed packets to capture files in several formats.
- Clear Window – clears the packet list.
- Generate Statistics – makes CommView generate statistics on the packets loaded in Log Viewer. Optionally, it is possible to reset previously collected statistical data displayed in the Statistics window. Please note that this function will not show packet distribution along the timeline. It is limited to displaying totals, protocol charts, and LAN hosts tables.
- Send to VoIP Analyzer – sends all packets from the current Log Viewer window to a new VoIP Log Viewer window for VoIP-specific analysis.
- Close Window – closes the window.
Search
- Find Packet – shows a dialog that allows you to find packets matching a specific text.
- Go to Packet Number – shows a dialog that allows you to jump to a packet with the specified number.
Rules
- Apply – applies your current rule set to the packets displayed in Log Viewer. As a result, when you use this command the program will delete the packets that don't match the current rule set. Note that this won't modify the file on the disk.
- From File … – does the same as the Apply command, but allows you to use a rule set from a previously saved .RLS file rather than the current rule set.
Rules
This tab allows you to set rules for capturing packets. If one or more rules are set, the program filters packets based on these rules and displays only the packets that comply with the rules. Note that CommView is not a firewall, and when you set rules, packets are still processed by the operating system; they are not just displayed and logged by CommView. If a rule is set, the name of the corresponding tab is displayed in bold font.
You can save your rules' configuration(s) to a file and load them by using the Rules command of the program's menu.
Since LAN traffic can often generate a high number of packets, it is recommended that you use rules to filter out unnecessary packets. This can considerably reduce the amount of system resources consumed by the program. If you want to enable/disable a rule, select the appropriate branch on the left side of the window (e.g. IP Addresses or Ports), and check or uncheck the box describing the rule (Enable IP Address rules or Enable port rules). There are eight types of rules that can be used:
Protocols & Direction
Allows you to ignore or capture packets based on Ethernet (Layer 2) and IP (Layer 3) protocols, as well as on packet direction.
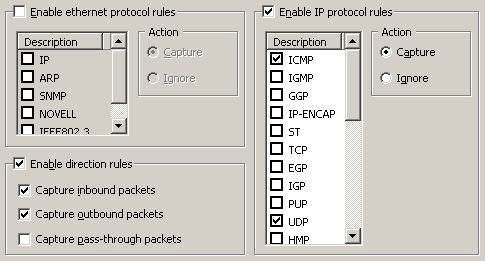
This example shows how to make the program capture only inbound and outbound ICMP and UDP packets. All other packets in the IP family will be ignored; all pass-through packets will be ignored also.
MAC Addresses
Allows you to ignore or capture packets based on MAC (hardware) addresses. Enter a MAC address in the Add Record frame, select the direction (From, To, or Both), and click Add MAC Address. The new rule will be displayed. Now you can select the action to be taken when a new packet is processed: the packet can be either captured or ignored. You can also click on the MAC Aliases button to get the list of aliases; double-click on the alias you would like to add, and the corresponding MAC address will appear in the input box.
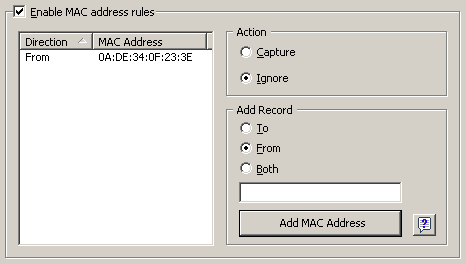
This example shows how to make the program ignore packets that come from 0A:DE:34:0F:23:3E. All packets that come from other MAC addresses will be captured.
IP Addresses
Allows you to ignore or capture packets based on IP addresses. Enter an IP or IPv6 address in the Add Record frame, select the direction (From, To, or Both), and click Add IP Address. You can use wildcards to specify blocks of IP addresses. The new rule will be displayed. Now you can select the action to be taken when a new packet is processed: the packet can be either captured or ignored. You can also click on the IP Aliases button to access the list of aliases; double-click on the alias you would like to add, and the corresponding IP address will appear in the input box.
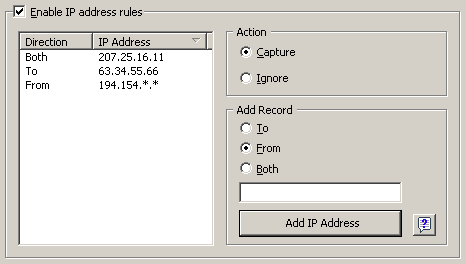
This example shows how to make the program capture the packets that go to 63.34.55.66, go to and come from 207.25.16.11 and come from all addresses between 194.154.0.0 and 194.154.255.255. All packets that come from other addresses or go to other addresses will be ignored. Since IP addresses are used in the IP protocol, such configuration will automatically make the program ignore all non-IP packets. Usage of IPv6 addresses requires Windows XP or higher and that the IPv6 stack be installed.
Ports
Allows you to ignore or capture packets based on ports. Enter a port number in the Add Record frame, select the direction (From, To, or Both), and click Add Port. The new rule will be displayed. Now you can select the action to be taken when a new packet is processed: the packet can be either captured or ignored. You can also press the Port Reference button to get a list of all known ports; double-click on the port you would like to add and its number will appear in the input box. You can also click on the Port Reference button to get a list of all known ports; double-click on the port you would like to add and its number will appear in the input box. Ports can also be entered as text; for example, you can type in http or pop3, and the program will convert the port name to the numeric value.
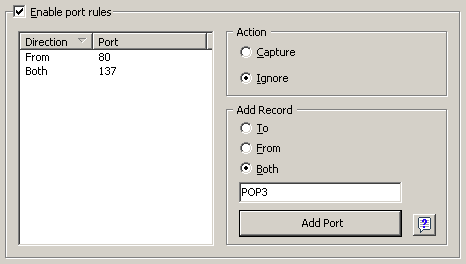
This example shows how to make the program ignore packets that come from port 80 and go to and come from port 137. This rule will prevent CommView from displaying inbound HTTP traffic, as well as inbound and outbound NetBIOS Name Service traffic. All packets coming to and from other ports will be captured.
TCP Flags
Allows you to ignore or capture packets based on TCP flags. Check a flag or a combination of flags in the Add Record frame, and click Add Flags. The new rule will be displayed. Now you can select the action to be taken when a new packet with the entered TCP flags is processed: the packet can be either captured or ignored.
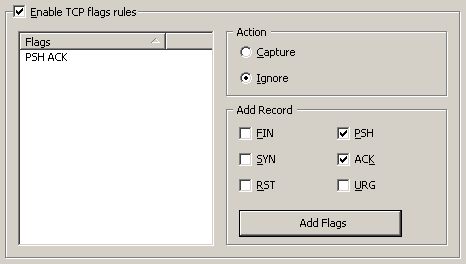
This example shows how to make the program ignore TCP packets with the PSH ACK flag. All packets with other TCP flags will be captured.
Text
Allows you to capture packets that contain certain text. Enter a text string in the Add Record frame and click Add Text. The new rule will be displayed. Now you can select the action to be taken when a new packet is processed: the packet can be either captured or ignored.
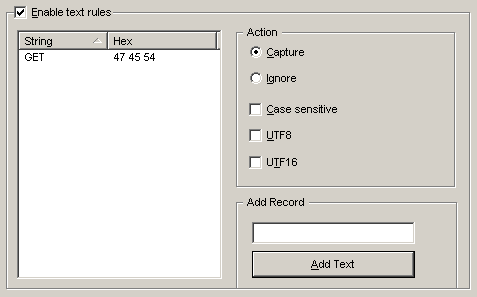
This example shows how to make the program capture only the packets that contain "GET". Check the Case sensitive box if you want the rules to be case-sensitive. Check the UTF8 or UTF16 box if you want the rule to match the text encoded using the respective encodings. All other packets that do not contain the text mentioned above will be ignored. If you would like to create a rule based on hex byte sequences, when the text is not printable (e.g. 0x010203), use the Advanced Rules.
Process
Allows you to capture packets based on the process name. Enter a process name in the Add Record frame and click Add Process Name. The new rule will be displayed. Now you can select the action to be taken when a new packet is processed: the packet can be either captured or ignored. You can enter partial process names, e.g. netscp or net; any process name that contains such a substring will match the rule. Process names are not case-sensitive.
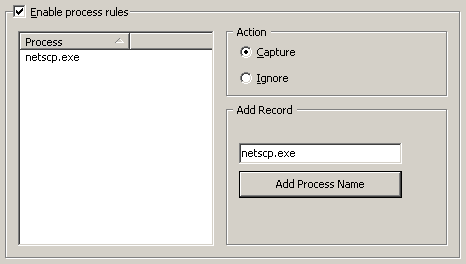
This example shows how to make the program capture only the packets that were sent or received by netscp.exe. Packets sent by other processes will be ignored.
Advanced
Advanced rules are the most powerful and flexible rules that allow you to create complex filters using Boolean logic. For the detailed help on using advanced rules, please refer to the Advanced Rules chapter.
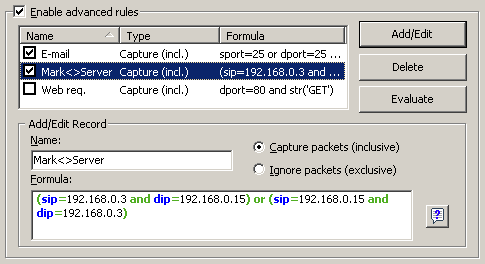
Advanced Rules
Advanced rules are the most powerful and flexible rules that allow you to create complex filters using Boolean logic. Using advanced rules requires a basic understanding of mathematics and logic, but the rules' syntax is rather easy to understand.
Overview
To add a new rule, you should enter an arbitrary name in the Name field, select the action (Capture/Ignore), enter a Formula using the syntax described below, and click Add/Edit. Your new rule will be added to the list and become active immediately. You can add as many rules as you wish, but only those rules that have a checked box next to the rule name are active currently. You can activate/deactivate rules by checking/unchecking the corresponding boxes or completely delete selected rules using the Delete button. If more than one rule is active, you can evaluate the resulting combined rule by clicking Evaluate. Please note that multiple active rules are combined using the logical OR operator, e.g. if you have three active rules, RULE1, RULE2, and RULE3, the resulting rule is RULE1 OR RULE2 OR RULE3.
You can use advanced rules in conjunction with the basic rules described in the previous chapter, however if you feel comfortable with Boolean logic, it's a good idea to use advanced rules only, as they offer much more flexibility. Basic rules are combined with advanced rules using the logical AND operator.
Syntax Description
- dir – Packet direction. Possible values are in (inbound), out (outbound), and pass (pass-through).
- etherproto – Ethernet protocol, the 13th and 14th bytes of the packet. Acceptable values are numbers (e.g. etherproto=0x0800 for IP) or common aliases (e.g. etherproto=ARP, which is equivalent to 0x0806).
- ipproto – IP protocol. Acceptable values are numbers (e.g. ipproto!=0x06 for TCP) or commonly used aliases (e.g. ipproto=UDP, which is equivalent to 0x11).
- smac – Source MAC address. Acceptable values are MAC addresses in hex notation (e.g. smac=00:00:21:0A:13:0F) or user-defined aliases.
- dmac – Destination MAC address.
- sip – Source IP or IPv6 address. Acceptable values are IP addresses in dotted notation (e.g. sip=192.168.0.1 or sip= fe80::02c0:26ff:fe2d:edb5), IP addresses with wildcards (e.g. sip!=*.*.*.255, except for IPv6 addresses), network addresses with subnet masks (e.g. sip=192.168.0.4/255.255.255.240 or sip=192.168.0.5/28), IP ranges (e.g. sip from 192.168.0.15 to 192.168.0.18 or sip in 192.168.0.15 .. 192.168.0.18), or user-defined aliases. Use of IPv6 addresses requires Windows XP or higher and that the IPv6 stack be installed.
- dip – Destination IP or IPv6 address.
- sport – Source port for TCP and UDP packets. Acceptable values are numbers (e.g. sport=80 for HTTP), ranges (e.g. sport from 20 to 50 or sport in 20..50 for any port number between 20 and 50) or the aliases defined by your operating system (e.g. sport=ftp, which is equivalent to 21). For the list of aliases supported by your OS click View => Port Reference.
- dport – Destination port for TCP and UDP packets.
- flag – TCP flag. Acceptable values are numbers (e.g. 0x18 for PSH ACK) or one or several of the following characters: F (FIN), S (SYN), R (RST), P (PSH), A (ACK), and U (URG), or the has keyword, which means that the flag contains a certain value. Usage examples: flag=0x18, flag=SA, flag has F.
- size – Packet size. Acceptable values are numbers (e.g. size=1514) or ranges (e.g. size from 64 to 84 or size in 64..84 for any size between 64 and 84).
- str – Packet contents. Use this function to indicate that the packet must contain a certain string. This function has three arguments: string, position, and case sensitivity. The first argument is a string, e.g. 'GET'. The second argument is a number that indicates the string position (offset) in the packet. The offset is zero-based, i.e. if you're looking for the first byte in the packet, the offset value must be 0. If the offset is not important, use –1. The third argument indicates the case-sensitivity and can be either false (case-insensitive) or true (case-sensitive). The second and third arguments are optional; if omitted, the offset defaults to –1 and the case-sensitivity defaults to false. Usage examples: str('GET',-1,false), str('GET',-1), str ('GET').
- hex – Packet contents. Use this function to indicate that the packet must contain a certain hexadecimal byte pattern. This function has two arguments: hex pattern and position. The first argument is a hex value, e.g. 0x4500. The second argument is a number that indicates the pattern position (offset) in the packet. The offset is zero-based, i.e. if you're looking for the first byte in the packet, the offset value must be 0. If the offset is not important, use –1. The second argument is optional; if omitted, the offset defaults to –1. Usage examples: hex(0x04500, 14), hex(0x4500, 0x0E), hex (0x010101).
- bit – Packet contents. Use this function to determine if the specified bit at the specified offset is set to 1, in which case the function returns true. If the specified bit is set to 0 or the specified byte is beyond the packet boundary, the function returns false. This function has two arguments: bit index and byte position. The first argument is the bit index in the byte; the allowed values are 0-7. The index is zero-based, i.e. if you're looking for the eighth bit in the byte, the index value must be 7. The second argument is a number that indicates the byte position (offset) in the packet. The offset is zero-based, i.e. if you're looking for the first byte in the packet, the offset value must be 0. Both arguments are mandatory. Usage examples: bit(0, 14) , bit(5, 1).
The keywords described above can be used with the following operators:
- and – Boolean conjunction.
- or – Boolean disjunction.
- not – Boolean negation.
- = – Arithmetic equality.
- != – Arithmetic inequality.
- <> – Same as above.
- > – Arithmetic greater-than.
- < – Arithmetic less-than.
- ( ) – parenthesis, control operator precedence rules.
All numbers can be in decimal or hexadecimal notation. If you want to use the hexadecimal notation, the number must be preceded by 0x, i.e. you can use either 15 or 0x0F.
Examples
Below you will find a number of examples illustrating the rules' syntax. Each rule is followed by our comments about what the rule does. The rules are shown in red. The comments are separated from the actual rule by two slashes.
- dir!=pass // Captures only inbound and outbound packets. Pass-through packets being sent between other workstations on the LAN are ignored.
- (smac=00:00:21:0A:13:0E or smac=00:00:21:0A:13:0F) and etherproto=arp // Captures ARP packets sent by two computers, 00:00:21:0A:13:0E and 00:00:21:0A:13:0F.
- ipproto=udp and dport=137 // Captures UDP/IP packets sent to the port number 137.
- dport=25 and str('RCPT TO:', -1, true) // Captures TCP/IP or UDP/IP packets that contain "'RCPT TO:" and where the destination port is 25.
- not (sport>110) // Captures everything except the packets where the source port is greater than 110.
- (sip=192.168.0.3 and dip=192.168.0.15) or (sip=192.168.0.15 and dip=192.168.0.3) // Captures only the IP packets being sent between two machines, 192.168.0.3 and 192.168.0.15. All other packets are discarded.
- ((sip from 192.168.0.3 to 192.168.0.7) and (dip = 192.168.1.0/28)) and (flag=PA) and (size in 200..600) // Captures TCP packets the size of which is between 200 and 600 bytes coming from the IP addresses in the 192.168.0.3 - 192.168.0.7 range, where destination IP address is in the 192.168.1.0/255.255.255.240 segment, and where the TCP flag is PSH ACK.
- Hex(0x0203, 89) and (dir<>in) // Captures the packets that contain 0x0203 at the offset 89, where the packet direction is not inbound.
Alarms
This tab allows you to create alarms that can notify you about important events, such as suspicious packets, high bandwidth utilization, unknown addresses, etc. Alarms are very useful in a situation were you need to watch the network for some suspicious events, for example distinctive byte patterns in captured packets, port scans, or unexpected hardware device connections.
Alarms are managed using the alarm list shown below:
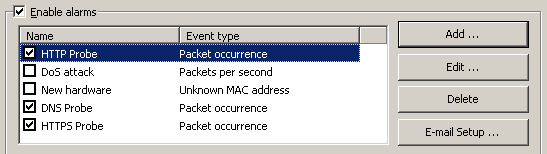
Each line represents a separate alarm, and the checkbox next to the alarm name indicates if the alarm is currently active. When an alarm is triggered, the check mark disappears. To reactivate a deactivated alarm, check the box next to its name. To disable all alarms, uncheck the Enable alarms box. To add a new alarm or edit or delete an existing one, use the buttons to the right of the alarm list. The E-mail Setup button should be used for entering information about your SMTP server if you plan to use e-mail notification options (see below).
The alarm setup window is shown below:
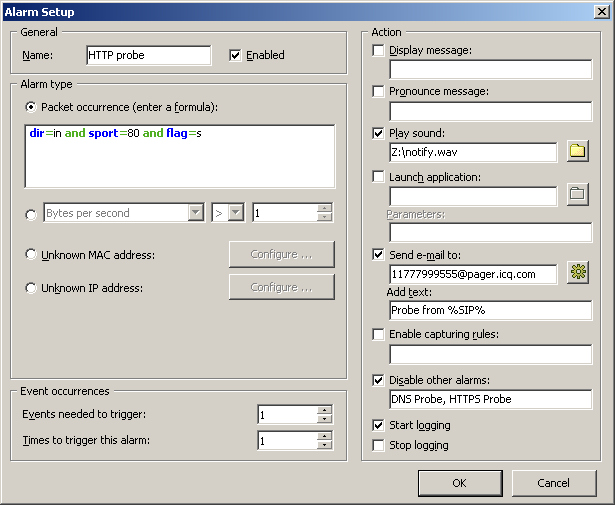
The Name field should be used for describing the alarm function. Check the Enabled box if you want the alarm that you're adding/editing to be activated once you've finished its setup. This check box is equivalent to the one shown in the alarms list. The Alarm Type frame allows you to select one of the seven alarm types:
- Packet occurrence: The alarm will be triggered once CommView has captured a packet that matches the given formula. The formula syntax is the same as the syntax used in Advanced Rules and is described in the Advanced Rules chapter in detail.
- Bytes per second: The alarm will be triggered once the number of bytes per second has exceeded (or fallen below) the specified value. Note that you should enter the value in bytes, so if you would like to have the alarm triggered when the data transfer rate exceeds 1Mbyte per second, the value you should enter is 1000000.
- Packets per second: The alarm will be triggered once the number of packets per second has exceeded (or fallen below) the specified value.
- Broadcasts per second: The alarm will be triggered once the number of broadcast packets has exceeded (or fallen below) the specified value.
- Multicasts per second: The alarm will be triggered once the number of multicast packets has exceeded (or fallen below) the specified value.
- Unknown MAC address: The alarm will be triggered once CommView has captured a packet with an unknown source or destination MAC address. Use the Configure button to enter known MAC addresses. This alarm type is useful for detecting new, unauthorized hardware devices connected to your LAN.
- Unknown IP address: The alarm will be triggered once CommView has captured a packet with an unknown source or destination IP or IPv6 address. Use the Configure button to enter known IP addresses. This alarm type is useful for detecting unauthorized IP connections behind a corporate firewall. Use of IPv6 addresses requires Windows XP or higher and that the IPv6 stack be installed.
The Events needed to trigger field allows you to specify the number of times the expected event must occur before the alarm is triggered. For example, if you specify the value of 3, the alarm will not be triggered until the even occurs three times. If you edit an existing alarm, the internal event counter will be reset.
The Times to trigger this alarm field allows you to specify the number of times your alarm may be triggered before the deactivation. By default, this value equals 1, so the alarm will be disabled after the first even occurrence. By increasing this value, you will make CommView trigger the alarm multiple times. If you edit an existing alarm, the internal trigger counter will be reset.
The Action frame allows you to select the actions to be performed when the alarm event occurs. The following actions are available:
- Display message: Shows a non-modal message box with the specified text. This action allows use of variables that are to be replaced by the corresponding parameters of the packet that has triggered the alarm. These variables are listed below:
%SMAC% -- source MAC address.
%DMAC% -- destination MAC address.
%SIP% -- source IP address.
%DIP% -- destination IP address.
%SPORT% -- source port.
%DPORT% -- destination port.
%ETHERPROTO% -- Ethernet protocol.
%IPPROTO% -- IP protocol.
%SIZE% -- packet size.
%FILE% -- the path to a temporary file that contains the captured packet.
For example, if your message is "SYN packet received from %SIP%", in the actual pop-up window text %SIP% will be replaced by the source IP address of the packet that triggered the alarm. If you use the %FILE% variable, a .NCF file will be created in the temporary folder. It is your responsibility to delete the file after it has been processed; CommView makes no attempt to delete it. You should not use variables if the alarm is triggered by Bytes per second or Packets per second values, as these alarm types are not triggered by individual packets.
- Pronounce message: Makes Windows speak the specified text using the text-to-speech engine. This box is disabled if your Windows version doesn't have the text-to-speech engine. By default, Windows only comes with English computer voices, so Windows may not be able to pronounce messages correctly if the text is entered in a language other than English. You can use the variables described in the Display message section in the message text.
- Play sound: Plays the specified WAV file.
- Launch application: Runs the specified EXE or COM file. Use the optional Parameters field to enter command line parameters. You can use the variables described in the Display message section above as the command line parameters if you want your application to receive and process information about the packet that triggered the alarm.
- Send e-mail to: Sends e-mail to the specified e-mail address. You MUST configure CommView to use your SMTP server prior to sending e-mail. Use the E-mail Setup button next to the alarm list to enter your SMTP server settings and send a test e-mail message. Usually, an e-mail message can also be used to send alerts to your instant messaging application, cell phone, or pager. For example, to send a message to an ICQ user, you should enter the e-mail address as ICQ_USER_UIN@pager.icq.com, where ICQ_USER_UIN is the user's unique ICQ identification number, and allow EmailExpress messages in the ICQ options. Please refer to your instant messenger documentation or cell phone operator for more information. The Add text field can be used to add an arbitrary message to the e-mail notification. You can use the variables described in the Display message section in the message text.
- Enable capturing rules: Enables Advanced Rules; you should enter the rule name(s). If multiple rules must be enabled, separate them with a comma or semicolon.
- Disable other alarms: Disables other alarms; you should enter the alarm name(s). If multiple alarms must be enabled, separate them with a comma or semicolon.
- Start logging: Turns on auto-saving (see the Logging); CommView will start dumping packets to the hard drive.
- Stop logging: Turns off auto-saving.
Click OK to save the settings and close the alarm setup dialog.
All the events and actions related to the alarms will be listed in the Event Log window below the alarm list.
Reconstructing TCP Sessions
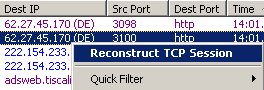
This tool allows you to view the TCP conversation between two hosts. To reconstruct a TCP session, you should first select a TCP packet on the Packets tab. Depending on the settings (the Search for the session start when reconstructing TCP sessions box in Settings => Options => Decoding), the session will be reconstructed from the selected packet that may be in the middle of the "conversation" or from the session start. After you locate and select the packet, right-click on it and select Reconstruct TCP Session from the pop-up menu as shown below:
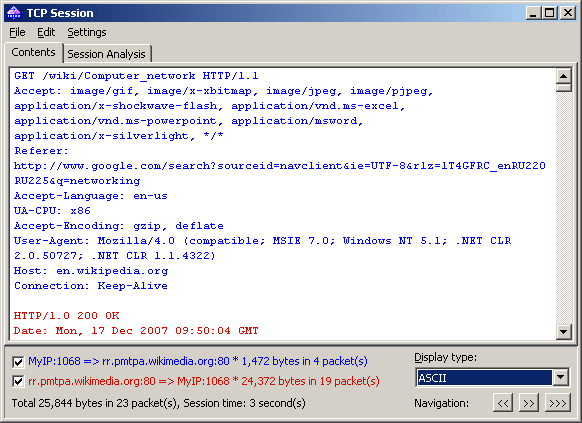
Reconstructing sessions works best for text-based protocols, such as POP3, Telnet, or HTTP. Of course, you can also reconstruct a download of a large zipped file, but it can take CommView a long time to reconstruct several megabytes of data, and the obtained information would be useless in most of the cases. The Contents tab displays the actual session data, while the Session Analysis tab graphically displays the flow of the reconstructed TCP session.
A sample HTTP session that contains HTML data displayed in ASCII and HTML modes is shown below:
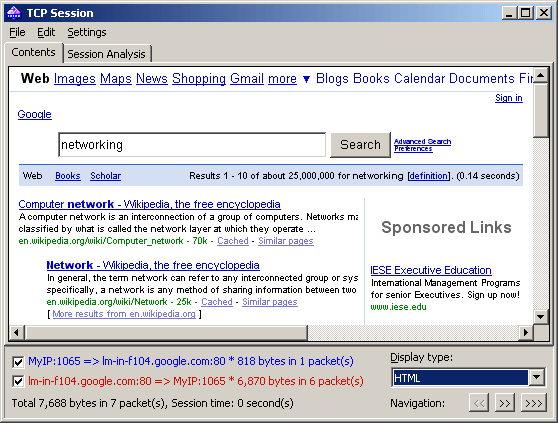
In HTML display mode, HTML pages never include inline graphics, because in HTTP protocol images are transferred separately from HTML data. To view the images, usually it is necessary to navigate to the next TCP session. A sample HTTP session that contains image data displayed in HTML mode is shown below:
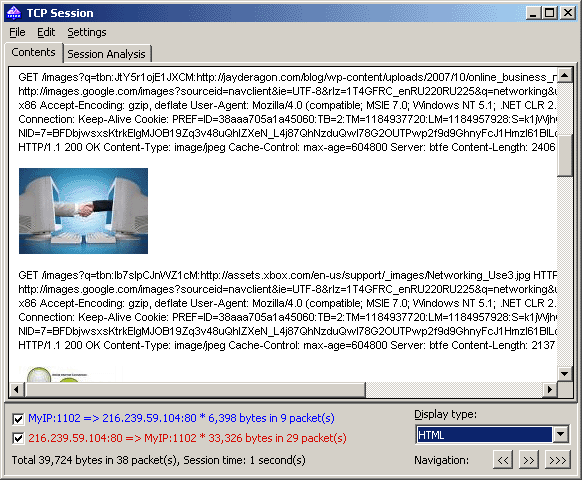
By default, CommView attempts to decompress GZIP'd web content and reconstruct images from binary streams. If you want to turn off this functionality, use the Decoding tab of the program's Options dialog.
You can filter out the data that came from one of the directions by unchecking one of the checkboxes on the bottom pane. Incoming and outgoing data are marked by different colors for your convenience. If you want to change one of the colors, click Settings =>Colors and pick a different color. You can enable or disable word wrapping using the Word Wrap item in the Settings menu.
The Display type drop-down list allows you to view data in the ASCII (plain-text data), HEX (hexadecimal data), HTML (web pages and images), EBCDIC (IBM mainframes' data encoding), and UTF-8 (Unicode data) formats. Please note that viewing data as HTML does not necessarily produce exactly the same result as the one you can see in the web browser (e.g. you will not be able to see inline graphics); however, it should give you a good idea of what the original page looked like.
You can choose the default display type for the TCP Session Reconstructions window in the Decoding tab of the program's Options dialog.
The Navigation buttons allow you to search the buffer for the next or previous TCP session. The first forward button (>>) will search for the next session between those two hosts that were involved in the first reconstructed session. The second forward button (>>>) will search for the next session between any two hosts. If you have multiple TCP sessions between the two hosts in the buffer and you'd like to see them all one by one, it is recommended to start the reconstruction from the first session, as the back button (<<) cannot navigate beyond the TCP session that was reconstructed first.
The obtained data can be saved as binary data, HTML, text, or rich text file by clicking File =>Save As… . When saving in text format, the resulting file is a Unicode UTF-16 file. When saving in HTML format, the encoding of the resulting file depends on the currently selected Display type. If HTML is currently selected, the resulting file is an ANSI text file; for all other display types the resulting file is a Unicode UTF-16 file. Note that if you're saving an HTTP session with images, the images in the saved HTML file are stored in the temporary location on your hard drive, so if you want to preserve them, open the saved file in your browser and re-save the file in a format that includes images, such as MHT, before closing CommView.
You can search for a string in the session by clicking Edit => Find… .
Session Analysis
The Session Analysis tab of the TCP Session window graphically displays the reconstructed TCP session. You can see the session data flow, errors, delays, and retransmissions of lost data.
The following data is displayed for every session packet:
- TCP flags.
- Absolute and relative SEQ and ACK values.
- Packet arrival time.
- Delta time between the current and previous packet.
- Packet number in the reconstructed session.
If a packet contains errors, the nature of the error is explained. It appears as a text description along the right edge of the graph. When you move the mouse over a packet, its contents are displayed in a hint window if the packet contains any data. Note that the Display type field affects the way the data is decoded in the hint window. A sample session analysis window is shown below:
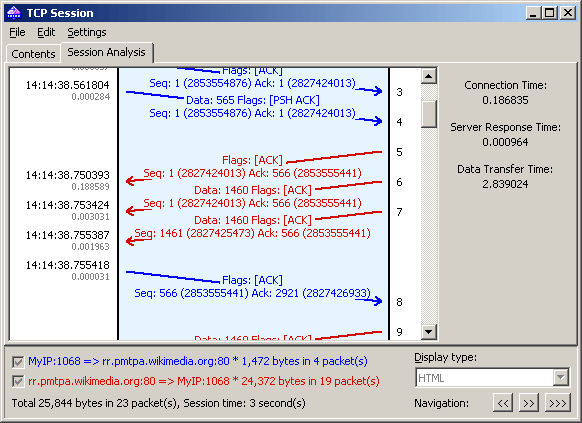
The right pane shows some basic statistics for the given session:
- Connection Time – the time it took to establish the TCP connection. In other words, it's the three-way TCP handshake time (SYN => SYN ACK => ACK).
- Server Response Time – the time elapsed between the initial client request and the server's first data response.
- Data Transfer Time – the time between the server's first and final data responses (0 if there was only one server response).
You can save the graphic layout of the reconstructed TCP session as a BMP, GIF, or PNG file by right-clicking on the layout and selecting the Save Image As… menu item of the context menu. Sessions with a large number of packets will be split into multiple files.
Reconstructing UDP Streams
This tool is very similar to the TCP session reconstruction tool described in the previous chapter; please refer to it for more information. However, because unlike TCP, UDP is a connectionless protocol, the following distinctions exist between TCP session reconstruction and UDP stream reconstruction:
- There is no Session Analysis tab, as there are no sessions, SEQs or ACKs in UDP.
- Because there are no SYNs or FINs in UDP, all packets between the given pairs of IP addresses and ports are considered to belong to the same stream.
Searching Packets
To find packets matching a specific text or address, use the Find dialog (Search => Find Packet). Enter a search string, select the type of entered information (String or Hex), and then click Find Next. The program will search for packets that match the search criterion and display them on the Packets tab.
You can enter text as a string, hexadecimal value, MAC or IP address. Text string search will be performed in ASCII and Unicode (UTF-8 and UTF-16) formats. A hex string should be used when you want to enter non-printable characters: just type in the hexadecimal string, e.g. AD0A027804. Use of IPv6 addresses requires Windows XP or higher and that the IPv6 stack be installed.
Check Match Case for case-sensitive search. Check At offset to search for a string that begins at a certain offset. Note that the offset indicator is hexadecimal and zero-based (i.e. if you're looking for the first byte in the packet, the offset value is 0). You can also select a search direction, Up or Down.
Statistics and Reports
This window (View => Statistics) displays vital network statistics of your PC or LAN segment, such as packets per second rate, bytes per second rate, Ethernet protocols, IP protocols and sub-protocols distribution graphs. You can copy any of the graphs to the clipboard by double-clicking on the graph. Ethernet protocols, IP protocols and sub-protocols "pie" graphs can be rotated using the small buttons in the lower right corner for better visibility of the slices.
The data displayed on each page can be saved as a bitmap or comma-delimited text file using the context menu or drag-and-drop. The Report page allows you to have CommView automatically generate customizable reports in HTML or comma-delimited text formats.
Network statistics can be collected either by using all the data that passes through your network adapter or by using the rules that are currently set. If you want the statistics counters to process only the data (packets) that match the current rule set and ignore all other data, you should check the Apply current rules box.
General
Displays Packets per second and Bytes/Bits per second histograms, a bandwidth utilization gauge (traffic per second divided by the NIC or modem link speed), as well as the overall packet and byte counters. Double-clicking on the gauge brings up a dialog window that allows you to manually configure the adapter speed to be used in the bandwidth utilization calculations.
Protocols
Displays the distribution of the Ethernet protocols, such as ARP, IP, SNAP, SPX, etc. Use the Chart by drop-down list to select one of the two available calculation methods: by number of packets or by number of bytes.
IP Protocols
Displays the distribution of the IP protocols. Use the Chart by drop-down list to select one of the two available calculation methods: by number of packets or by number of bytes.
IP Sub-protocols
Displays the distribution of the main IP application-level sub-protocols: HTTP, FTP, POP3, SMTP, Telnet, NNTP, NetBIOS, HTTPS, and DNS. To add more protocols, click on the Customize button. This dialog allows you to define up to 8 custom protocols. You should enter a protocol name, select the IP protocol type (TCP/UDP), and port number. Use the Chart by drop-down list to select one of the two available calculation methods: by number of packets or by number of bytes.
Sizes
Displays the packet size distribution chart.
Hosts by MAC
Lists active LAN hosts by MAC address and displays data transfer statistics. You can assign aliases to MAC addresses. If you have too many multicast packets on your network and the Hosts by MAC table is overpopulated, you may want to group multicast addresses to one line that will be named GroupedMulticast. You can enable this function by checking the Group multicast addresses box. Please note that only the packets that arrived after this option has been set will be grouped accordingly; the previously received packets will not be affected by this option.
Hosts by IP
Lists active LAN hosts by IP address and displays data transfer statistics. Since IP packets captured by the program can be originated from an unlimited number of IP addresses (both internal to your LAN and external), by default this tab doesn't display any statistics. To have the statistics displayed, you should first set the range of IP addresses to be monitored by clicking Add/Set Ranges. Normally, these ranges should belong to your LAN, and configuring the program to monitor a certain range of IP addresses allows you to have the usage statistics. You can enter any number of ranges, but the total number of IP addresses being monitored cannot exceed 1,000. To delete a range, right-click on the list of ranges and select the appropriate menu command. You can assign aliases to IP addresses. Additionally, you can check the All box to have the program list all IP addresses; however, this option is not recommended for RAM and CPU utilization reasons.
Matrix by MAC
This page displays the graphical conversation matrix between hosts based on their MAC addresses. The hosts represented by their MAC addresses are placed on the circle, and the sessions between them are shown as lines that connect the hosts. Moving the mouse over a host highlights all connections that this host makes with other hosts. You can change the number of the most active host pairs that are displayed in the matrix by changing the value in the Most active pairs field. To change the number of the latest address pairs examined by the program, modify the value in the Latest pairs to count field. If your network segment has many broadcast or multicast packets that overpopulate the matrix, you can ignore such packets by checking the Ignore broadcasts and Ignore multicasts boxes.
Matrix by IP
This page displays the graphical conversation matrix between hosts based on their IP addresses. The hosts represented by their IP addresses are placed on the circle, and the sessions between them are shown as lines that connect the hosts. Moving the mouse over a host highlights all connections that this host makes with other hosts. You can change the number of the most active host pairs that are displayed in the matrix by changing the value in the Most active pairs field. To change the number of the latest address pairs examined by the program, modify the value in the Latest pairs to count field. If your network segment has many broadcast or multicast packets that overpopulate the matrix, you can ignore such packets by checking the Ignore broadcasts and Ignore multicasts boxes.
Errors
Displays the information on the Ethernet errors obtained directly from the adapter. Below are the explanations of the error types:
Rx CRS Errors
The number of frames received with circular redundancy check (CRC) or frame check sequence (FCS) error.
Rx Alignment Errors
The number of frames received with alignment errors.
Rx Overrun
The number of frames not received due to overrun errors on the NIC.
Tx One Collision
The number of frames successfully transmitted after exactly one collision.
Tx More Collisions
The number of frames successfully transmitted after more than one collision.
Tx Deferred
The number of frames successfully transmitted after the NIC defers transmission at least once.
Tx Max Collisions
The number of frames not transmitted due to excessive collisions.
Tx Underrun
The number of frames not transmitted due to underrun errors on the NIC.
Tx Heartbeat Failure
The number of frames successfully transmitted without detection of the collision-detect heartbeat.
Tx Times CRS Lost
The number of times the CRS signal has been lost during packet transmission.
Tx Late Collisions
The number of collisions detected after the normal window.
Rx Frames w/Errors
The number of frames that a NIC receives but does not indicate to the protocols due to errors.
Rx Frames w/o Errors
The number of frames that the NIC receives without errors and indicates to bound protocols.
Tx Frames w/Errors
The number of frames that a NIC fails to transmit.
Tx Frames w/o Errors
The number of frames that are transmitted without errors.
Please note that:
- Dial-up adapters are not supported, only hardware Ethernet cards.
- Your adapter may not support all the listed fields. Some vendors make NICs that provide all the required information, others don't.
- Unlike other data in the Statistics window, the data on the Errors tab cannot be reset when you click the Reset button. The counter is initialized when your computer boots up.
Report
This tab allows you to have CommView automatically generate customizable reports in HTML (including images of charts and graphs) or comma-delimited text formats.
It is possible to have the program generate statistics on pre-captured data in addition to real-time statistics. To do that, load a capture file in Log Viewer and click File => Generate Statistic. You can optionally reset previously collected statistics displayed in the Statistics window. Please note that this function will not show packet distribution along the timeline. It is limited to displaying totals, protocol charts, and LAN hosts tables.
Using Aliases
Aliases are easy-to-remember human-readable names that CommView will substitute for a MAC or IP address when showing the packets on the Packets and Statistics tabs. This can make packets easier to recognize and analyze. For example, 00:00:19:2D:0D:35 becomes GATEWAY2, and ns1.earthlink.com becomes MyDNS.
To add a MAC alias right-click on a packet and select Create Alias Using Source MAC or Using Destination MAC from the pop-up menu. A window will pop up where the MAC address field is already filled out, and you will only need to type in an alias. Alternatively, you can click Settings => MAC Aliases … and fill out the MAC address and Alias fields manually. To delete an alias or clear the entire aliases list, right-click on the Aliases window and select Delete Record or Clear All. The same applies to creating IP aliases. When a new IP alias is created by right-clicking on a packet, the alias field is pre-filled with the corresponding hostname (if available) and can be then edited by the user.
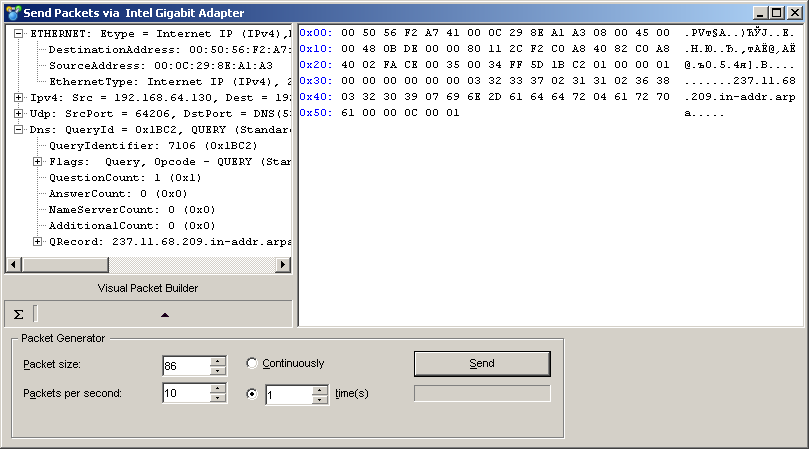
Packet Generator
This tool allows you to edit and send packets via your network card. To open the Packet Generator, click Tools => Packet Generator, or select a packet from the Packets tab, right-click on it, and select the Send Packet command.
Please note that the Packet Generator cannot and should not be used for sending application-layer TCP streams, i.e. it cannot take care of incrementing SEQ or ACK values automatically, adjusting checksums and packet sizes and so forth. If you need to send a TCP stream, you should use a Winsock-based application specifically designed for that purpose. The Packet Generator is a tool for replaying pre-captured data, testing firewalls and intrusion detection systems, as well as for performing other specific tasks that require manual packet crafting.
The Packet Generator allows you to change the packet contents and have the packet decode displayed in the left window as you edit it. You can create packets of any kind; you have full control over the packet contents. For IP, TCP, UDP, and ICMP packets, you can automatically correct the checksum(s) by clicking on the Sigma button. To assist you with packet editing, the Visual Packet Builder tool is also available; click on the corresponding button to invoke it.
You can also click on the button with an arrow on it to display the list of available packet templates. The program comes with TCP, UDP, and ICMP packet templates; using them is often faster than typing hex codes in the editor window. These templates contain typical TCP, UDP, and ICMP packets, but you would most probably want to edit many packet fields and use meaningful values that suit your needs, such as real MAC and IP addresses, port numbers, SEQ and ACK numbers, etc. You can use your own templates rather than the built-in ones. You can drag-and-drop a packet from the CommView Packets tab to the Templates' section in the Packet Generator window. If you drop several packets into the Templates section, only the first packet will be used as a template. An entry named New Template will appear in the list of templates. You can rename a template by right-clicking on it in the list and selecting Rename. If you need to delete a template, right-click on it and select Delete from the pop-up menu. Selecting a template in the list will load the packet that it contains in the editor window where it can be edited prior to sending.
You can also place NCF files with the templates of your choice to the TEMPLATES subfolder in the application folder. If CommView finds NCF files (or just one of them) in the TEMPLATES subfolder, it will list them among the available templates in the drop-down list. These NCF files should contain only one packet per file, but if you use a file that contains many packets, CommView will load only the first one.
Once you have edited a packet, use the controls below to send it:
- Packet Size – modifies the packet size.
- Packets Per Second – controls the speed at which packets will be sent. Be sure not to send packets too fast if you have a slow connection. For example, sending a 1,000 byte packet 5,000 times per second is more than your 10Mbit NIC can handle.
- Continuously – select this option if you want the Packet Generator to send packets continuously until you click Stop.
- Time(s) – select this option if you want the Packet Generator to send packet a given number of times.
- Send/Stop – click this button when you are ready to send packets or to stop sending them.
Working with multiple packets
You can use the Packet Generator to send multiple packets at once. To do that, just select the packets you want to send in the list and invoke the Packet Generator using the right-click menu, or drag and drop the selected packets to the Packet Generator window. Alternatively, you can drag and drop capture files in all supported formats directly to the Packet Generator window. When multiple packets are being sent, the packer editor and decoder tree become invisible.
Saving edited packets
If you edit a packet and would like to save it, just drag the decoder tree to the desktop or any folder, and a new file in NCF format containing the packet will be created. The file name is always PACKET.NCF. You can also drag the packet to the templates window. If you need to edit and send multiple packets, edit them one by one, each time dragging a new packet to the desktop and renaming it. After that, open a new Log Viewer window, drag-n-drop the edited packets from the desktop to Log Viewer, select them using the Shift button, and invoke the Packet Generator using the context menu.
WARNING !
- Don't use the Packet Generator unless you know exactly what effect you want to achieve. Sending packets may produce unpredictable results, and we strongly recommend refraining from using this tool unless you are an experienced network administrator.
- There should be at least one working computer on your LAN besides your own computer when you use this tool. Otherwise, you will experience severe delays in sending packets.
Visual Packet Builder
Visual Packet Builder is a tool designed for facilitating packet editing and generation in the Packet Generator. This tool allows you to quickly and correctly create a new packet or modify an existing one using ready-made templates. Once created or edited, a packet can be injected into the network using the Packet Generator.
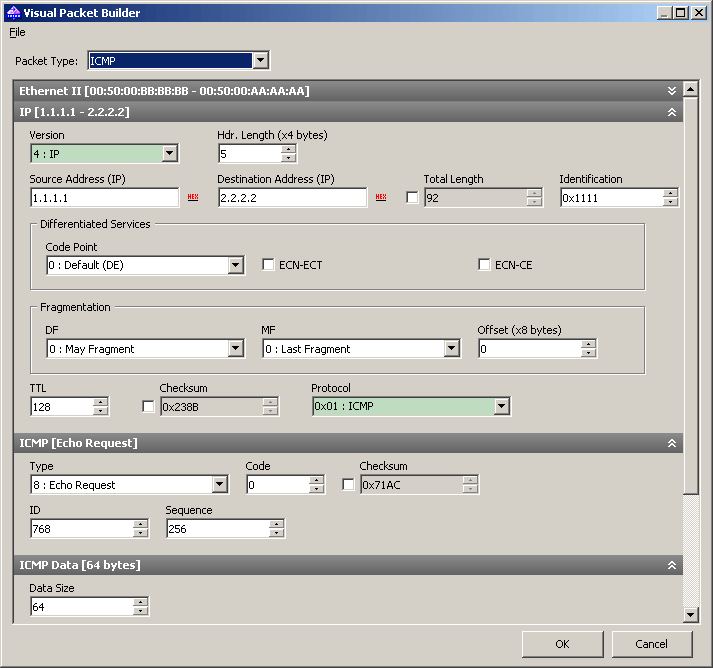
Standard TCP, UDP, and ICMP (based on the 4th and 6th versions of IP protocol), and ARP packet generation is supported. To create a packet, select its type from the Packet Type drop-down list. The default values of the packet fields will be automatically filled in, but can be changed afterwards.
ICMP, TCP, UDP, and ARP packets consist of several encapsulated layers, and the interface of Visual Packet Builder is arranged the same way. Options that correspond to the same layer are located on a separate panel. For example, a TCP packet consists of 4 layers; the Source MAC and Destination MAC address fields are located on the Ethernet II panel (Data link layer), and Src Port and Dst Port values are located on the TCP panel (Transport layer). If you'd like to hide a panel, click the Expand/Collapse button located in the right corner of the panel header.
Note that some "parental" layer values affect the packet type on lower layers; hence modifying upper layers may lead to rebuilding the lower layers of a packet. Therefore, if you change the Protocol type in the Ethernet II panel (Data link layer), it will lead to rebuilding the whole packet. Another peculiarity that you should keep in mind is that the values of some fields depend on the contents of other fields, as well as the data contents of the lower layers. Such fields are: checksums and header lengths, and/or data of lower layers. Visual Packet Builder calculates such values automatically. However, when creating non-standard packets, you may want to specify different values manually by checking the Override default value box and specifying the desired values.
Despite the fact that Visual Packet Builder has internal support for TCP, UDP, ICMP and ARP protocols only, you can still use it to edit packets that use other protocols. For such packets, you can use the hex editor to modify the data.
Once created, a packet can be saved and subsequently loaded to Visual Packet Builder again. Use the respective commands located in the File menu of Visual Packet Builder for loading/saving capture files. You can load any CommView capture file (NCF); however, if the file contains more than one packet, only the first one will be loaded.
NIC Vendor Identifier
The first 24 bits of a network card's MAC address uniquely identify the network card's vendor. This 24-bit number is called the OUI ("Organizationally Unique Identifier"). The NIC Vendor Identifier is a tool that allows you to look up a vendor name by MAC address. To look up a vendor name, click Tools =>NIC Vendor Identifier, enter a MAC address, and click Find. The vendor's name will be displayed. By default, CommView replaces the first three octets of the MAC address by the adapter vendor name in the Packets tab. This behavior may be changed by unchecking the Display vendor names in MAC addresses checkbox in the General tab of the program Options dialog.
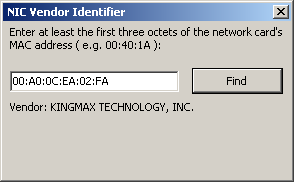
The list of vendors is contained in the MACS.TXT file located in the CommView application folder. You can manually edit this list to add/modify information.
Scheduler
You can use this tool to create and edit scheduled capturing tasks. This is useful when you want CommView to start and/or stop capturing when you're not around, for example, at night or on weekends. To add a new task, click Tools => Scheduler, and then click on the Add button.
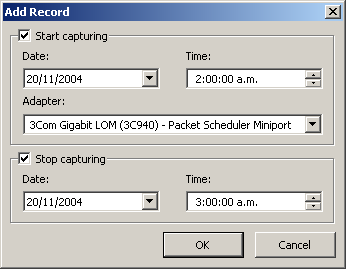
Use the Start capturing frame to specify the date and time when CommView will start capturing. Use the Adapter drop-down list to specify the adapter that should be used. Use the Stop capturing frame to specify the date and time when CommView will stop capturing. You don't necessarily have to check both Start capturing and Stop capturing boxes. If you check only the first box, capturing would go on until you manually stop it. If you check only the second box, you'd have to start capturing manually, but then CommView would automatically stop capturing at the specified time.
If CommView is already capturing packets at the time when the scheduled task is due and if the adapter you specified is different from the adapter currently being monitored, CommView will stop capturing, switch to the adapter you specified, and restart capturing.
It is important to understand that the scheduled tasks can be performed only when CommView is running.
Using Remote Agent
CommView Remote Agent is a companion product that can be used for monitoring network traffic remotely. All you have to do is to install Remote Agent on the target computer, and then use CommView to connect to Remote Agent. Once you are connected and authenticated, you can start monitoring as if you were there.
To switch to remote monitoring mode, click File => Remote Monitoring Mode. An additional toolbar will appear in the CommView main window next to the main toolbar. If you are behind a firewall or proxy server, or using a non-standard Remote Agent port, you may need to click on the Advanced Network Settings button to change the port number and/or enter SOCKS5 proxy server settings.
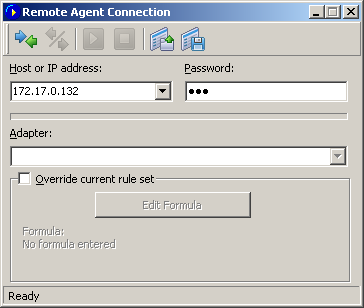
Click on the New Remote Agent Connection button to establish a new connection, or click on the Load Remote Agent Profile toolbar button to load a previously saved Remote Agent connection profile. A previously saved profile may also be loaded from the New Remote Agent Connection window.
A Remote Agent Connection window will appear where you can enter the IP address of the computer running CommView Remote Agent into the IP address input area, enter the connection password and click on the Connect button, and if the password is correct, a connection will be established. You will then see the Link Ready message in the status bar, and the adapter selection box will list the remote computer's adapters.
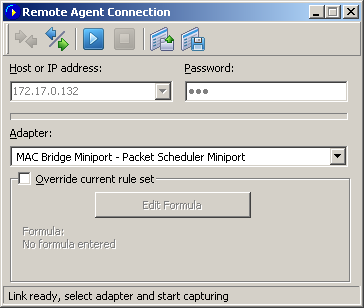
Now is the best time to configure the capturing rules using the Rules tab. It's very important to configure the rules correctly so that the volume of traffic between the Remote Agent and CommView doesn't exceed the bandwidth limit on either side of the connection, or you will experience noticeable lag. Be sure to filter out unnecessary packets (see more on this topic below). You can also apply a custom set of capturing rules to this connection and override the current rules defined in CommView by checking the Override current rule set box, clicking on the Edit Formula button and entering the rules' formula in the field below. The formula syntax is the same as the one used in Advanced Rules. Once you're ready to start monitoring, select the network adapter from the list and click the Start Capture toolbar button. CommView allows you to save the Remote Agent Connection settings as a connection profile for quick and easy access in the future. Click on the Save Remote Agent profile toolbar button in the New Remote Agent Connection window and enter a name for the file.
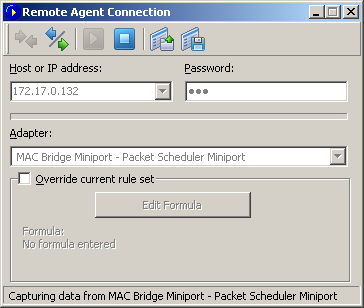
CommView will start to capture the remote computer's traffic as if it's your local network traffic; there is virtually no difference between using CommView locally and remotely. When you are done with remote monitoring, just click on the Stop Capture toolbar button. You can then change the adapter or disconnect from Remote Agent by clicking the Disconnect toolbar button. To return to the standard mode, click File => Remote Monitoring Mode, and the additional toolbar will disappear.
Please note that CommView can work with multiple Remote Agents simultaneously. You can open several remote connections, each having its own settings and an independent set of rules and collect the traffic from remote network segments in one CommView instance.
Using RPCAP
In addition to the remote capture functionality provided by CommView Remote Agent, CommView can also capture traffic from remote computers using the RPCAP (Remote Packet Capture) protocol. This protocol is supported by some hardware (e.g. Aerohive Access Points) and software (e.g. WinPcap).
To switch to remote monitoring mode, click File => Remote Monitoring Mode. An additional toolbar will appear in the CommView main window next to the main toolbar. Click the New RPCAP Connection button to open a new connection window.
To connect to a remote device, enter its hostname or IP address, specify the port number (RPCAP uses port 2002 by default), check the User Authentication box and specify a user name and password, if authentication is required, and then check the Promiscuous mode box if that is the capture mode you wish to use. Click Connect to establish a connection. Once the connection has been established, the Adapter drop-down list will be populated by available network interfaces. Click Capture to start capturing.
Capturing Decrypted SSL Traffic
In addition to physical and virtual network adapters, CommView allows you to select one of the "Decrypted SSL" adapters for capturing and decrypting local SSL traffic. These are not real adapters; rather, they are emulated and called "adapters" for simplicity. When you capture decrypted local SSL traffic from these adapters, CommView emulates TCP packets using intercepted SSL sessions. As a result, you can work with those packets just like you would normally work with any other packets from real adapters.
When working with decrypted SSL traffic, please keep in mind the following:
- Only local SSL traffic can be decrypted. In other words, CommView (or any other software) cannot decrypt other computers' encrypted traffic. If it could, we would have probably received a multimillion-dollar award for the greatest breakthrough in cryptography.
- It is highly recommended that you close your browsers before you start capturing SSL traffic and open them after you have started capturing. This is necessary to make sure that the browsers are able to update their list of trusted certificates; CommView adds its certificate to the trusted store, thereby making it possible to intercept and decrypt SSL traffic.
- We cannot guarantee that CommView can decrypt each and every SSL session originating from your computer. Some applications use highly customized components for SSL encryption. We did, however, make sure that all modern popular browsers are supported.
- Once you have started capturing, some applications might complain about an "unknown" or "untrusted" SSL certificate. This is normal, as CommView acts as a middleman between the software running on your computer and the server it connects to. This involves temporary (only when CommView is capturing data) replacing of the server certificate with CommView’s own certificate. If you see such a "unknown certificate" message, simply restart the application in question. This should solve the problem in most cases. If this doesn't help, you may want to add CommView's certificate to the application's trusted certificate store, if it has one. The certificate can be found at C:\Program Files (x86)\CommView\certs\SSL\CommView CA 2.cer (for 64-bit Windows) or C:\Program Files\CommView\certs\SSL\CommView CA 2.cer (for 32-bit Windows). If this doesn't help either, unfortunately there is nothing we can do.
- The TCP/IP packets that you see in this capture mode are emulated. This means that they have artificial Ethernet, IP, and TCP headers. Such packets have specific source and destination MAC addresses: 00:00:00:00:10 and 00:00:00:00:20 for inbound packets and vice versa for outbound packets. They also have emulated SEQ and ACK values.
- Because packets are emulated, they may not fully reflect the structure of the real SSL session. For example, a 10,000-byte-long SSL-encrypted Web page sent to your browser may be transferred using 7 or 8 encrypted TCP packets in reality, but in CommView, the entire page may be presented as a single 10,000-byte-long TCP packet that contains decrypted data. Similarly, SSL session handshakes are not displayed, as they carry no useable payload.
There are three types of decrypted SSL emulated adapters to choose from:
- Local SSL (Decrypted)
- Local SSL (Decrypted) + HTTP
- Local SSL (Decrypted) + TCP
The first one captures only SSL sessions. The second one captures SSL sessions and HTTP (unencrypted) sessions. The third one captures SSL sessions and any other TCP sessions. Please note that all of the three modes present emulated TCP sessions, with the specificities described above. If you want to see original, unmodified packets as sent/received by your network adapter, then select that adapter rather than one of the emulated adapters in CommView.
Capturing Loopback Traffic
CommView allows you to capture traffic on the loopback interface. To start monitoring the loopback interface, select it from the drop-down list in the toolbar.
Loopback packets are the packets sent/received within the same computer, i.e. self-addressed packets. Typically, there is virtually no loopback traffic on the standard PC. However, loopback traffic is widely used by software developers for debugging network-related applications. Therefore, CommView's loopback capturing functionality is targeted primarily at this user group.
When you capture loopback traffic, the packets look exactly as any other network packets, except that the checksums are not computed. Please pay attention to the following peculiarities when capturing loopback traffic:
- CommView captures loopback traffic on all of the local IP addresses. This always includes 127.0.0.1/255.0.0.0, but may also include the IP addresses of your Ethernet adapters, e.g. 192.168.0.1.
- ICMP packets cannot be captured. Other IP protocols can (TCP, UDP, etc.).
- Only successfully sent/received packets are captured. For example, if a connection attempt fails because the destination port is closed, you will not see any SYN / RST packets.
- Sessions are silently closed; no FIN packets are captured.
Port Reference
This window (View => Port Reference) displays a table of port numbers and corresponding service names. This reference is obtained from the SERVICES file installed by Windows. You can find the SERVICES file in the \system32\drivers\etc folder. You can manually edit this file if you want to add more ports/service names. CommView reads this file on start up, so your changes to the file will be displayed only after you restart the program.
Setting Options
You can configure some of the program's options by selecting Settings => Options in the menu.
General
- Auto-start capturing – check this box if you want CommView to start capturing packets immediately after launching the program. For systems with multiple adapters, you should also select the adapter to be used from the drop-down list.
Network
- Disable DNS resolving – check this box if you don't want CommView to perform reverse DNS lookups of the IP addresses. If you check it, the Hostname column on the Latest IP Connections tab will be blank.
- Convert numeric port values to service names – check this box if you want CommView to display service names rather than numbers. For example, if this box is checked, port 21 is shown as ftp, and port 23 as telnet. The program converts numeric values to service names using the SERVICES file installed by Windows. You can find the SERVICES file in the \system32\drivers\etc folder. You can edit this file manually if you want to add more ports/service names.
- Convert MAC addresses to aliases – substitute MAC addresses for aliases on the Packets tab. Aliases can be assigned to MAC addresses using the Settings =>MAC Aliases menu command.
- Convert IP addresses to aliases – substitute IP addresses for aliases on the Packets and Statistics tabs. Aliases can be assigned to IP addresses using the Settings =>IP Aliases menu command.
- Convert IP addresses to hostnames in the "Packets" tab – check this box if you want CommView to show resolved hostnames rather than IP addresses in the Packets tab. If this box is checked, CommView will first attempt to find an alias for the given IP address. If no alias is found or the previous box (Convert IP addresses to aliases) is not checked, CommView will query the internal DNS cache for the hostname. If no hostname is found, the IP address will be displayed in numeric form.
- Display vendor names in the MAC addresses – by default, CommView replaces the first three octets of the MAC address by the adapter vendor name on the Packets tab. Uncheck this checkbox if you want to change this behavior.
- Use non-promiscuous mode – by default, CommView puts the network adapter in promiscuous mode, which means that the program captures all traffic in the local LAN segment. Checking this box switches CommView to non-promiscuous mode, which you sometimes may want to use, e.g. if your company's IT policy doesn't allow promiscuous packet monitoring, or to reduce CPU usage in the situation where you're interested only in your own inbound and outbound packets and have to filter out many pass-through packets.
- Notify when the adapter list has changed – check this box if you want CommView to display a balloon message in the system tray area once the number of active network adapters has been changed.
- Display full process path – check this box if you want to see the full path to the process sending/receiving packets in the Latest IP connections tab, as well as in the decoded packets' tree in the Packets tab (e.g. "C:\Files\Program.exe" is a full path, whereas "Program.exe" is a short path).
- Display friendly adapter names – checking this option will make CommView display the adapter names in the adapter selection drop-down list in the toolbar as they appear in the Windows Network Connections page.
- Show gridlines – makes the program draw gridlines in all packet lists.
Memory Usage
Display
- Maximum packets in buffer – sets the maximum number of packets the program stores in the memory and can display in the packet list (2nd tab). For example, if you set this value to 3000, only the last 3000 packets will be stored in the memory and packet list. The higher this value is, the more computer resources the program consumes.
- Note that if you want to have access to a high number of packets, it is recommended that you use the auto-saving features (see Logging for more information): it allows you to dump all the packets to a log file on the hard drive.
- Maximum lines in Latest IP Connections – sets the number of lines the program displays on the Latest IP Connections tab. When the number of connections exceeds the limit, the connections that have been idle for the longest period of time are removed from the list.
- Driver Buffer – sets the driver buffer size. This setting affects the program's performance: the more memory allocated for the driver buffer, the fewer packets the program drops. For low traffic LANs and dial-up connections, the buffer size is not critical. For high traffic LANs, you may want to increase the buffer size if the program drops packets. To check the number of dropped packets, use the File => Performance Data menu command while capturing is on.
Latest IP Connections
- Display Logic – allows you to select the Latest IP Connections layout that best suits your needs. Selecting an item from the drop-down list will display the description of the selected logic. In most cases, it is recommended to use the default Smart logic.
- Define Local IP Addresses – you should use this tool if you monitor LAN traffic with many pass-through packets and a mixture of external and internal IP addresses. In such a situation CommView doesn't "know" which IP addresses should be treated as local and might reverse the IP addresses in the Local and Remote IP columns. This tool allows you to define the local network addresses and subnet masks to make sure the Latest IP Connections window works correctly. This will work only if you use the default Smart logic.
- Add numeric PID to process names – check this box if you'd like the process ID (PID) shown next to the process name in the Process column.
Colors
- Packet color – sets the color for displaying packets on the Packets tab based on the packet direction (in, out, pass-through). To change a color, select the packet direction from the drop-down list and click on the colored rectangular.
- Colorize Packet Headers – check this box if you want CommView to colorize packet contents. If this box is checked, the program displays the first eight packet layers using different colors. To change a color, select the type of header for which you want to change the color and click on the colored rectangular.
- Formula syntax highlighting – sets the colors for highlighting keywords in formulas in the Advanced Rules window.
- Selected byte sequence color – sets the font and background color for displaying the byte sequence that was selected in the decoder tree. For example, when you select the "TCP" tree node, the corresponding part of the packet will be highlighted using these colors.
Decoding
- Always fully expand all nodes in the decoder window – check this box if you would like to have all nodes in the decoder windows automatically expanded when you select a new packet in the packet list.
- Expand the last nodes – check this box if you would like to have the last node(s) in the decoder window automatically expanded when you select a new packet in the packet list and set the number of nodes to be expanded. By default, the first node is expanded. This setting has no effect if the Always fully expand all nodes in the decoder window box is checked.
- Expand level – set the number of levels to expand. This defines the "depth" of tree node expansion.
- Decode up to the first level only in ASCII export – this option affects the decoding format used when you export a packet log or individual packet as ASCII file with decode. If this box is checked, only the top-level nodes will be saved. For example, if you save a TCP/IP packet when this option is disabled, all Type of service sub-nodes are saved. When this option is enabled, these sub-nodes are not saved. Checking this box makes the output ASCII file less detailed and more compact.
- Ignore incorrect checksums when reconstructing TCP sessions – this option affects the way CommView treats malformed TCP/IP packets when reconstructing TCP sessions. By default, this option is on, and packets with incorrect checksums are not discarded in the process of reconstruction. If you turn off this option, packet with incorrect checksums will be discarded and not displayed in the TCP reconstruction window. Attention Gigabit card users: all your outbound packets will have incorrect checksums if the "checksum offload" feature is present. If you turn off this option, it's likely that you will see only half of the reconstructed TCP stream. The same applies to reconstructing loopback sessions, as loopback packets have zero checksums.
- Include packet numbers when reconstructing TCP sessions – check this box if you'd like the chunks of data shown in the TCP session reconstruction window to be prepended by the packet numbers that correspond to these chunks of data.
- Search for the session start when reconstructing TCP sessions – if this box is checked, the program will attempt to find the beginning of the TCP session when you reconstruct it. If it is not checked, the session will be reconstructed only from the selected packet, i.e. earlier packets will be discarded.
- Decompress GZIP content – check this box if you want CommView to convert GZIP-compressed HTTP content into readable text in the TCP Session Reconstruction windows. GZIP content is decompressed only when the display type in the window is set to "ASCII".
- Reconstruct images – check this box if you want CommView to convert binary HTTP streams that represent images into viewable JPG, BMP, PNG, and GIF pictures in the TCP Session Reconstruction windows. Images are shown only when the display type in the window is set to "HTML". Images are never shown within the HTML pages to which they belong, as they are transferred by the server in a separate HTTP session.
- Use IPv4-style endings in IPv6 addresses – if this box is not checked, IPv6 addresses are shown using hexadecimal symbols only, e.g. fe80::02c0:26ff:fe2d:edb5. If this box is checked, the last 4 bytes of IPv6 addresses are shown using the IPv4-style dotted notation, e.g. fe80::02c0:26ff:254.45.237.181.
- Reassemble fragmented IP packets – check this box if you'd like the program to reassemble IP packets that are fragmented. By default, fragmented IP packets are displayed as they were received from the wire, in their original form. If this option is turned on, the program will maintain an internal buffer of fragments and will attempt to "glue" them, displaying only the results of successful reassembly.
- Attempt to map incoming UDP packets to processes – by default, the program's packet-to-application mapping system does not try to map incoming UDP packets to an owning process due to the probabilistic nature of such mapping. Check this box if you'd like the program to attempt to map these packets.
- Default display type – select the display type value from the drop-down list that you want to set as default for TCP Session Reconstruction function. The available values are ASCII, HEX, HTML, and EBCDIC.
VoIP
- Disable VoIP analysis – disables capture and analysis of VoIP data. Check this box if you don't plan to work with VoIP and want to minimize the usage of computer resources by the application.
- Maximum records in the list – limits the number of displayed and processed VoIP events. When the number of records exceed the specified limit, older records are deleted from the lists.
- Ignore orphan RTP streams – when this box is checked, VoIP analyzer will ignore captured RTP data streams that don't have a parent signaling session. Orphan RTP streams typically appear if packet capturing was started in the middle of a call, or the signaling protocol is unknown to the application (i.e. not SIP and not H.323), or the signaling protocol was sent in a non-standard manner (e.g. encrypted or as part of some other session). Such streams are still available for analysis, and sometimes for playback. Please see the Call Playback chapter for more detailed information on playing VoIP calls. If you are not interested in such orphan streams and want to save on computer resources, please disable this option. Note that when orphan streams are not ignored, VoIP analyzer may mistakenly identify data transferred over UDP protocol as RTP streams. Generally, this is not an error, as RTP packets don't have a standard uniform signature, so such "false positives" are ok.
Geolocation
Geolocation is IP-to-country mapping for IP addresses. When this functionality is enabled, CommView checks the internal database to provide information on the country any IP address belongs to. You can configure the program to show ISO country code, Country name, or Country flag next to any IP address. You can also disable geolocation. For some IP addresses, such as reserved ones (e.g. 192.168.*.* or 10.*.*.*) no information on the country can be provided. In such cases, the country name is not shown, or if you use the Country flag option, a flag with a question mark is displayed.
As IP allocation is constantly changing, it's important that you always have an up-to-date version of CommView. A fresh, up-to-date database is included in every CommView build. A fresh database has 98% accuracy. Without updates, the accuracy percentage falls by approximately 15% every year.
Miscellaneous
- Hide from the taskbar on minimization – check this box if you don't want to see the program's button on the Windows taskbar when you minimize the program. If this box is checked, use the program's system tray icon to restore it after minimization.
- Allow multiple application instances – check this box if you would like have multiple CommView instances running simultaneously to be able to capture traffic going through different adapters. This option is not available under Windows 95.
- Prompt for confirmation when exiting the application – check this box if you would like the program to ask you for a confirmation when you close it.
- Auto-scroll packet data window – if this box is checked, the program scrolls the text of the packet data window automatically when you select a new packet from the packets list (but only if the text does not fit into the window). This is useful when you want to see the contents of a long packet without manually scrolling the window.
- Auto-scroll packet list to the last packet – if this box is checked, the program automatically scrolls the packet list in the Packets tab down to the last received packet.
- Auto-sort new records in the Latest IP Connections – if this box is checked, the program auto-sorts new records on the Latest IP Connections tab based on the user-defined sorting criterion (e.g. ascending order of remote IP addresses).
- Smart CPU utilization control – if this box is checked, the program tries to decrease CPU utilization when capturing high-volume traffic by decreasing the quality and frequency of the screen updates.
- Run on Windows startup – if this box is checked, the program is launched automatically every time you start Windows. Under Windows Vista and higher, this box is disabled if UAC is enabled. This is a limitation of Windows Vista and newer Windows versions that prevent applications with elevated rights from loading on startup. If this feature is important, disable UAC.
- Run minimized – if this box is checked, the program is launched minimized and the main window is not displayed until you click on the tray icon or taskbar button.
- Enable automatic application updates – check this box to let the program connect to the TamoSoft Website periodically and check for updates. Use the Interval between checks box to configure how often the checks should be made.
Plug-ins
This tab is used by 3-rd party plug-ins for performing configuration tasks. Please see Custom Decoding chapter for more information.
Frequently Asked Questions
In this chapter you can find answers to some of the most frequently asked questions. The latest FAQ is always available at https://www.tamos.com/products/commview/faq.php
Q. Can CommView be used for capturing dial-up (RAS) adapter traffic?
A. Yes.
Q. What exactly does CommView "see" when installed on a PC connected to a LAN?
A. CommView enables the network card's promiscuous mode and can capture network traffic on the local segment of the LAN. In other words, normally it captures and analyzes packets addressed to all of the computers on the segment, not only to the one where the program is running. There are certain limitations for Wireless Ethernet adapters (you can monitor only inbound/outbound traffic) and switched networks (see the next question about switches in this FAQ).
Q. I am connected to the LAN through a switch, and when I launch CommView, it captures only the packets sent to and from my machine. I can't see the traffic of other machines. Why is this so?
A. Unlike hubs, switches prevent promiscuous sniffing. In a switched network environment, CommView (or any other packet analyzer) is limited to capturing broadcast and multicast packets and the traffic sent or received by the PC on which CommView is running. However, most modern switches support "port mirroring", which is a feature that allows you to configure the switch to redirect the traffic that occurs on some or all ports to a designated monitoring port on the switch. By using this feature, you will be able to monitor the entire LAN segment. We wrote a white paper, Promiscuous Monitoring in Ethernet and Wi-Fi Networks, that covers these topics in detail.
Q. Ok, I am connected to the LAN through a hub, but I can't see other machines' traffic again, as if it's a switch. Why is this so?
A. There are two possible reasons: Either you have a hub that is only labeled as a hub, but inside is a switch (some vendors like Linksys do that), or you have a multi-speed hub, in which case you can't see the traffic from the stations operating at the speed that is different from your NIC's speed (e.g. if you have a 10 Mbit NIC, you can't see the traffic generated by 100 Mbit NICs).
Q. I have a home LAN connected to the Internet via a broadband router, and I can see only my own traffic. Is it possible to capture the traffic of other machines on my home LAN?
A. In brief, yes. There are a few methods that can help you solve this problem. For more information and sample network layouts, please refer to our white paper, Promiscuous Monitoring in Ethernet and Wi-Fi Networks.
Q. Can CommView capture data from a network adapter that doesn't have an IP address?
A. Yes. In fact, the network adapter does not need to be bound to TCP/IP or any other protocol. In a situation where you are troubleshooting a network it might be necessary to be able to plug in the computer running CommView into an available port on a hub. In such cases you do not need to guess the IP address available in the LAN segment, all you need to do is unbind the network adapter from TCP/IP and start capturing. Open Control Panel => Network Connections, right-click on the connection icon, select Properties, and uncheck the boxes corresponding to the protocols you don't want to be bound to the NIC.
Q. I'm on a LAN with high traffic volume, and it's hard to examine individual packets when the application is receiving hundreds of thousands of packets per second, as the old packets are quickly removed from the circular buffer. Is there anything I can do about it?
A. Yes, you can use the Open current buffer in new window button on the small toolbar on the Packets tab. This will allow you to make snapshots of the current buffer as many times as you wish, at any intervals. You will then be able to explore the packets in these new windows at your leisure.
Q. I launched the program and clicked "Start Capture", but no packets are displayed. Why?
A. There are two possible reasons: You either selected an unused network adapter, or you made a mistake when configuring the capturing rules. Turn off the rules and see what happens. In any case, even when the capturing rules are on, the program's status bar should display the total number of packets, so have a look at it before panicking.
Q. I noticed that IP/TCP/UDP checksums in the outgoing packets are incorrect. Why is it so?
A. New Gigabit network adapters have a feature called TCP/UDP/IP "checksum offload", which allows the network adapter to calculate packet checksums, thus increasing the system performance and decreasing CPU utilization. Since CommView intercepts packets before they reach the network adapter, the checksum appears to be incorrect. This is normal and the only thing that it might affect is the reconstruction of TCP sessions and only if you changed the default "Ignore incorrect checksums" option (see Setting Options for more information).
Q. Does CommView run on multiprocessor computers?
A. Yes, it does.
Q. It seems to be impossible to save more than 5,000 packets from the packet buffer. Is there a workaround?
A. Actually, there is no such limitation. The application uses a circular buffer for storing captured packets. By default, the buffer can contain up to 5,000 latest packets, but this value can be adjusted in the Settings window. The maximum buffer size is 20,000 packets (the buffer cannot be unlimited for an obvious reason: your computer’s RAM is not unlimited). You can save the contents of the buffer to a file using the Logging tab. However, by no means does this limit on the buffer size restrict your ability to save any number of packets. You simply need to enable automatic logging on the Logging tab. Such automatic logging will make the application dump all the captured packets to file(s) continuously, and you can set any limit on the total size of the captured data.
Q. My network connection is via a cable/xDSL modem. Will CommView be able to monitor traffic on it?
A. If your modem has a dual USB/Ethernet interface and you can connect it to an Ethernet card, CommView will certainly capture traffic on it. If it has only a USB interface, the best thing to do is to try.
Q. My firewall software warns me that CommView is "attempting to access the Internet." I am aware that some sites are able to track users by collecting the information sent by their programs via Internet. Why does CommView "attempt to access the Internet"?
A. Three activities may alert your firewall. First, it may be an attempt to resolve IP addresses to hostnames. Since CommView has to contact your DNS servers to make a DNS query, it inevitably triggers the alarm. You can disable this feature (Settings => Options => Disable DNS resolving), but in this case, the Latest IP Connections tab will not be able to show you the hostnames. Second, you may have configured the program to check if updates or new versions are available. To do this, CommView has to connect to www.tamos.com. You can disable this feature (Settings => Options => Misc. => Enable automatic application updates). Third, when you purchase the product, you need to activate it. If you select online activation, CommView has to connect to www.tamos.com. You can avoid this by selecting manual activation. These are the only types of connections CommView can potentially make. There are no other hidden activities. We don't sell spyware.
Q. I'm often logged on as a user without administrative privileges. Do I have to log off and then re-logon as the administrator to be able to run CommView?
A. No, you can open CommView folder, right-click on the CV.exe file while holding down the Shift key, and select "Run As" from the pop-up menu. Enter the administrative login and password in the window that pops up and click OK to run the program. Under Windows Vista and higher, CommView is automatically launched with elevated rights.
Q. Can CommView monitor a network adapter when running under Microsoft Virtual PC?
A. Yes. The only limitation is that promiscuous mode is not available for virtual adapters, so you'll be limited to capturing your own and broadcast packets only.
Q. When I monitor my dial-up connection, I don't see any PPP packets during the session set up (CHAP, LCP, etc). Is this normal?
A. Sorry, PPP handshaking packets cannot be captured. Note that all other PPP packets that follow the initial handshaking process are captured.
Q. I use WireShark and I noticed that it could no longer capture packets after CommView had been installed.
A. There is a known conflict between WinPcap, the driver used in WireShark and many similar products, and the driver used in CommView. There is a simple workaround: Start capturing packets with WireShark before you start capturing packets with CommView. In this case, both products will be able to capture data simultaneously. If you start capturing with CommView first, WinPcap will fail to capture any packets for a reason unknown to us.
Q. When reconstructing TCP sessions that contain HTML pages in Japanese or Chinese, I can't see the original text.
A. To see text in East Asian languages, you should install East Asian fonts. Open Control Panel => Regional and Language Options, select the "Languages" tab, and check the "Install files for East Asian languages" box.
Q. I'm confused about the license types available for CommView. Could you explain the difference between the license types?
A. There are three CommView license types:
- The more expensive VoIP License grants you the right to use the program anywhere for any commercial or noncommercial purpose and enables all the application features, including VoIP analyzer.
- The less expensive Enterprise License grants you the right to use the program anywhere for any commercial or noncommercial purpose, excluding the VoIP analyzer.
- The least expensive Home License grants you the right to use the program at home for noncommercial purposes. If you use CommView to monitor your home network, the maximum number of hosts in your LAN this license allows you to monitor cannot exceed ten. The Home license wouldn't allow you to connect to CommView Remote Agents. The Home license wouldn't allow you to capture loopback traffic. The Home license doesn't enable VoIP analyzer.
Additionally, the Enterprise License is also available as a One Year Subscription, which is a time-limited license valid for one year from the date of purchase only.
Please refer to the End User License Agreement that comes with the product for other licensing terms and conditions.
Q. Can I save the audio from the VoIP analyzer to a standard .wav or .mp3 file?
A. Not directly, but there are many utilities on the market that offer a "virtual audio cable" that allows saving anything that is played back through your sound card to a file. Try, for example, Xilisoft Sound Recorder (use the "What you hear" mode).