VoIP Analysis
Introduction
VoIP analyzer is a built-in CommView module that is suited for real-time capturing and analyzing Internet telephony (VoIP) events, such as call flow, signaling sessions, registrations, media streams, errors, etc. By visualizing this data and assessing voice quality, this tool helps you boost productivity in debugging VoIP networks, software, and hardware. CommView's VoIP analyzer supports SIP 2.0 and H.323 signaling protocols and RTP 2.0 media streams and many widespread codecs. In addition to real-time analysis, the analyzer can be used for post-capture import and analysis of capture logs in a number of formats (e.g. Tcpdump, EtherPeek, etc.).
Working with VoIP Analyzer
VoIP analyzer can be accessed through the VoIP tab of the main application window, where real-time analysis of captured packets is performed, or through the VoIP Log Viewer window that should be used when you wish to perform post-capture analysis of log files. VoIP analyzer works concurrently with packet capture and displays results in real-time:
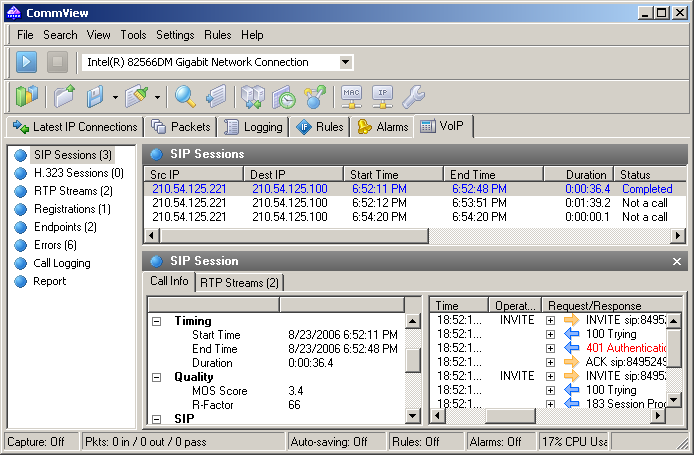
The information in the VoIP analyzer window is organized by several categories. The category list is located on the pane and allows selection and viewing of detailed analysis data that is displayed in the right part of the window. The following categories are available:
- SIP Sessions – list of captured SIP 2.0 sessions.
- H.323 Sessions – list of captured H.323 sessions.
- RTP Streams – list of captured RTP streams.
- Registrations – list of clients registered at the registration server and the clients' registration history.
- Endpoints – list of workstations involved in VoIP data exchange.
- Errors – list of errors registered during VoIP data exchange.
- Call Logging – logging configuration for captured VoIP data.
- Report – report generation configuration, including the automatic mode.
Please refer to Working with Lists in VoIP Analyzer for detailed information on how the data is arranged in VoIP analyzer.
SIP and H.323 Sessions
VoIP analyzer currently supports two types of VoIP signaling protocols, SIP and H.323. SIP and H.323 sessions are presented as two separate items on the left pane. Selecting one of the two items will display corresponding signaling sessions captured by the application and provide detailed information related to each session:
The upper pane displays a complete list of captured SIP or H.323 sessions. When selecting a SIP/H.323 session from the list, the lower pane displays detailed information on the selected session, including a detailed session log, summarized and statistical data, as well as the RTP streams related to the selected session:

If RTP streams are available for the selected signaling sessions, it's possible to play a call by clicking Play.
See also:
RTP Streams
The Real-time Transport Protocol (or RTP) defines a standardized packet format for delivering audio and video over the Internet. While protocols like SIP or H.323 are used to control the call (e.g. setting up a connection, dialing, disconnecting, etc.), RTP is used for reliable transmission of data packets and maintaining Quality of Service. In other words, RTP streams carry the actual voice payload encoded utilizing one of a number of codecs, and analysis of RTP data provided invaluable information for assessing call quality and troubleshooting VoIP networks.
To view RTP streams captured by the application, select RTP Streams in the left pane of the VoIP analyzer window:
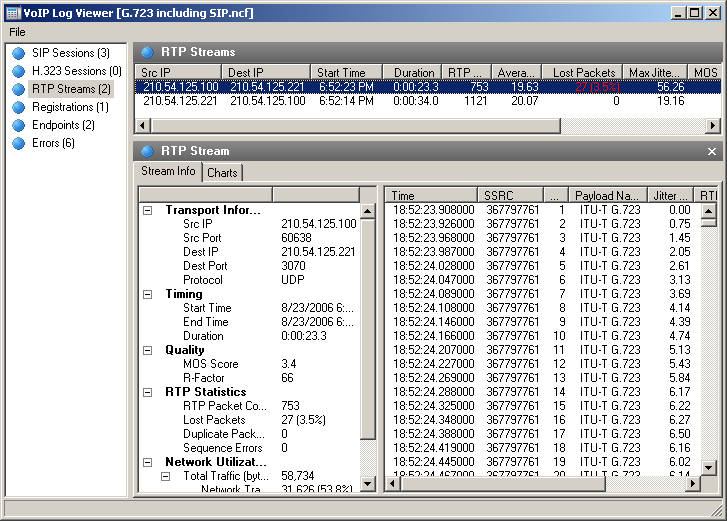
The upper part displays a complete list of all RTP streams. When selecting an RTP stream from the list, the lower pane displays detailed information on the selected stream, including the complete list of RTP packets, summarized and statistical data, as well as the charts:
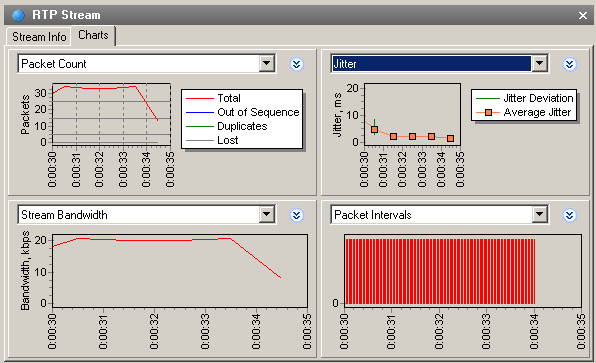
Up to four different charts for the selected stream can be displayed simultaneously, with the window interval from 5 to 60 seconds. Note that right-clicking and dragging the graph will scroll it to the left or right respectively. The following chart types are available:
- Packet Count – number of RTP packets per second including duplicates, lost packets, and "out of order" packets.
- Stream Bandwidth – stream speed in terms of kilobits per second.
- Packet Sizes – average sizes of RTP packets broken down by network and RTP headers, and RTP payload.
- Jitter – stream jitter.
- R-Factor, MOS Score – stream quality estimation.
- Packet Intervals – temporal allocation of RTP packets in a stream.
The RTP Streams list contains all captured RTP streams, both belonging to SIP or H.232 signaling sessions, and the ones for which signaling sessions were not identified (so called 'orphan' streams, i.e. the ones that don't belong to any parent session). Please refer to the Settings chapter for more detailed information on how to exclude RTP streams that don't have corresponding signaling sessions.
See also:
Registrations
To view the VoIP clients registered with the registration servers, select the Registrations item in the left pane of the VoIP analyzer window:
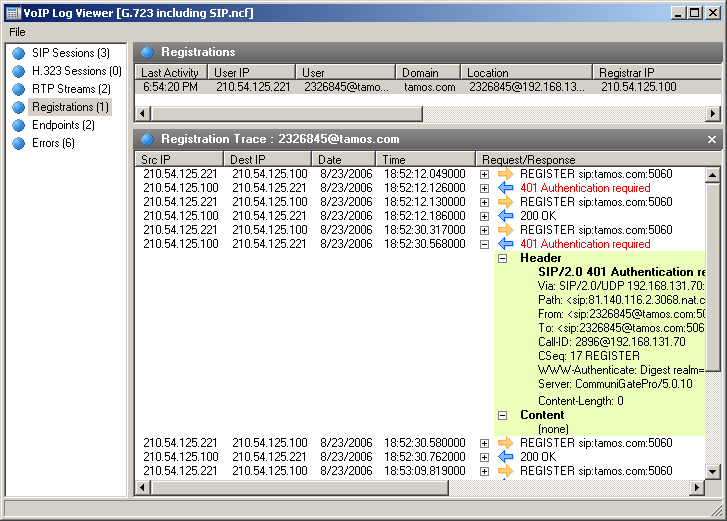
The upper part of the right pane displays a complete list of all registrations, including current registration status of VoIP clients. When you select a registration record, the registration message log containing the messages of the VoIP client sent to/received from the registration server is displayed.
Endpoints
This pane displays the list of workstations involved in the VoIP data exchange, including statistical data and top callers list:
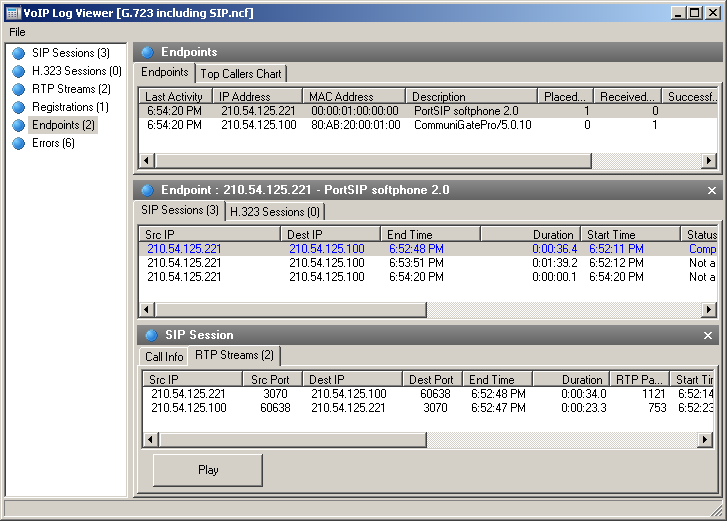
The complete list of workstations is displayed in the upper part of the pane. When you select an end point, the lower part of the pane displays the calls initiated or received by the selected computer.
Errors
This pane displays the list of recent errors registered during the data exchange between VoIP clients and servers:
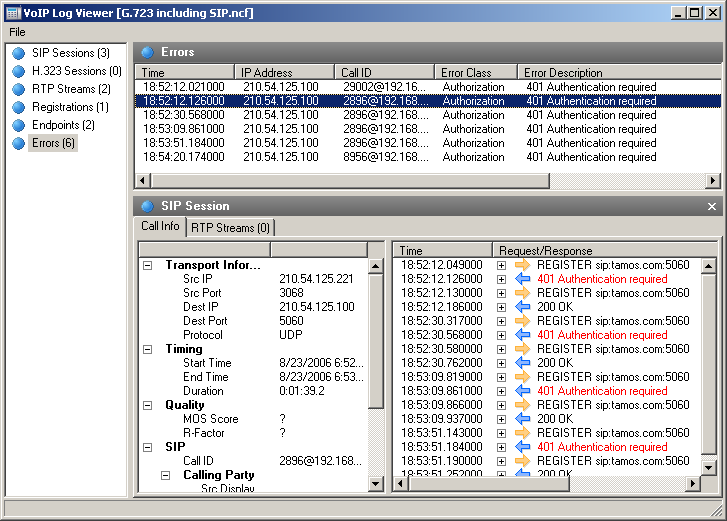
The list of recent errors is displayed in the upper part of the pane. When you select a record, related call information is displayed in the lower part of the pane.
Call Logging
Call logging allows you to save all VoIP-related packets to CommView capture files automatically:
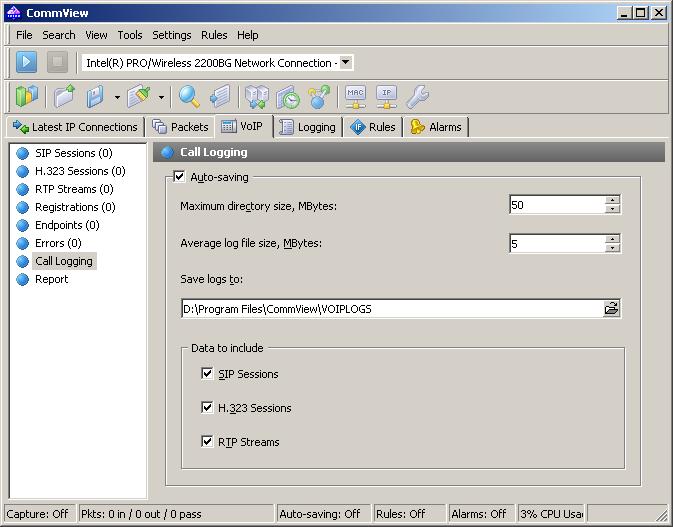
Enable the Auto-saving option and select the output data you want to be recorded in a log file. The Data to include frame lets you configure the specific packets that you want the application to log.
Reports
The Report pane is intended for automatic VoIP report generation:
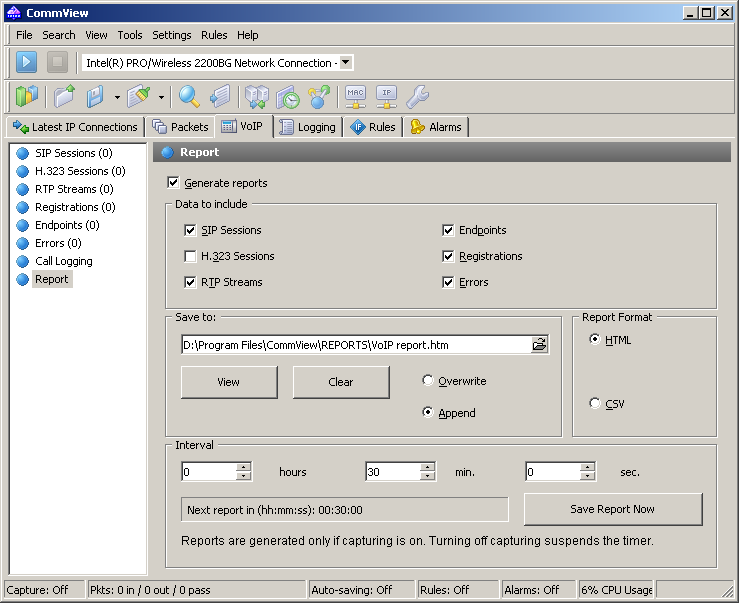
Checking the Generate reports box enables report generation. The Data to include frame lets you configure the specific information that you want to be included in the reports. You can also configure the report format (CSV or HTML) as well as the time intervals at which reports are generated. New reports can either replace old ones or be appended.
Call Playback
The call playback functionality can be used for assessing the audio quality experienced by the parties participating in a VoIP call. In most of the cases, VoIP analyzer allows you to play captured calls (this depends on the support of the specific codec(s) being used in the given VoIP call). To play a call, select the desired call record in the VoIP analyzer window, select the RTP Streams tab, and click on the Play button:
Alternatively, you can select any item on the right pane containing the list of RTP streams (for example, the RTP Streams category), select one or several streams, right-click on them, and select the Play Selected menu item. That way, it's possible to interrelate and play back the streams for which the signaling session is either absent, or the signaling protocol is not supported (i.e. the protocol is not SIP or H.323).
After clicking on the Play button, the Media Stream Player window will be opened:
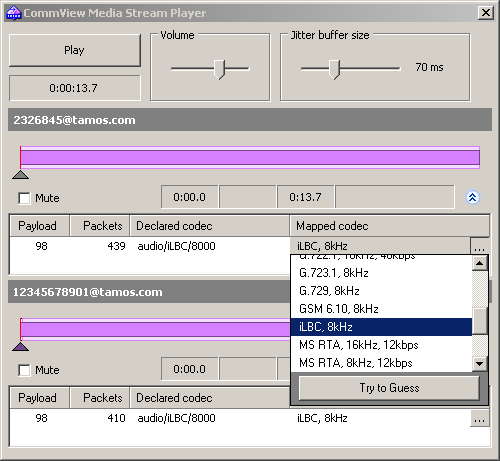
Click on the double-arrow button to have the application display more detailed information about the audio stream(s) and access to manual codec mapping. For each of the RTP streams you can:
- Manually synchronize a stream by time, i.e. set the starting time of playback in relationship to other streams. To do that, move the small triangle to the left or to the right.
- Select the correct sound codec for each of the payload types in the RTP stream. In most cases, Media Stream Player will automatically select the correct codec. However, when working with "orphan" RTP streams that lack parent SIP or H.323 sessions, and, therefore, information on the codecs being used, you will have to manually select the correct codec from the drop-down list. If you find it difficult to pick the correct codec, try clicking on the Try to Guess button and Media Stream Player will try to select the codec by itself.
Note that sometimes, it's not possible to play back audio from RTP streams, as these streams may be encrypted or use proprietary codecs or codecs not supported by CommView.
The Volume control allows you to adjust the sound volume. The Jitter buffer size control allows you to simulate the jitter buffer used in real world VoIP end nodes. A typical jitter buffer is 30 ms to 50 ms in size. Increasing the buffer size improves the voice quality but increases the delay.
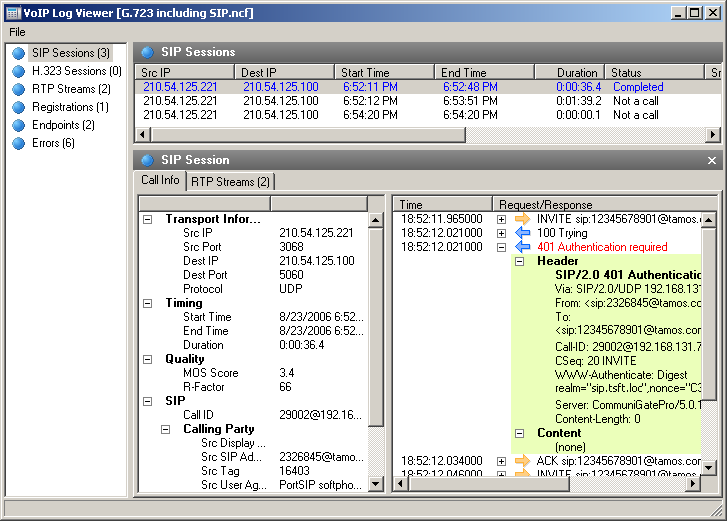
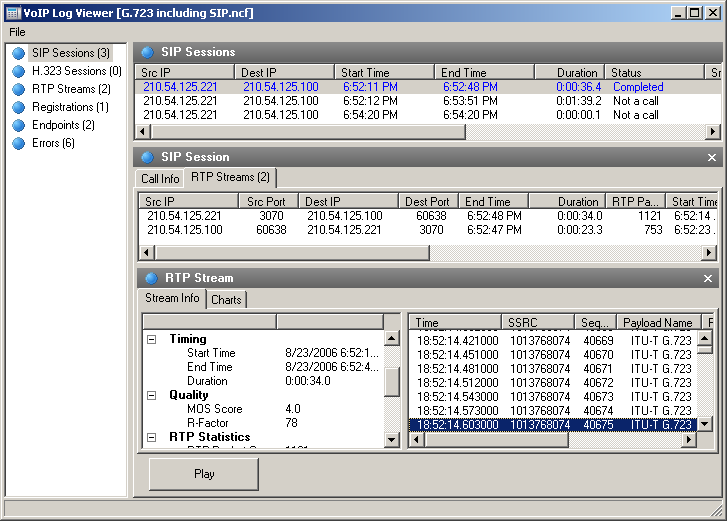
Viewing VoIP Logs
VoIP Log Viewer is a tool for viewing and analyzing capture files created by CommView and some other third party network analyzers. It has very similar functionality to the VoIP analyzer that is part of the main application window; however, its purpose is post-capture analysis, i.e. working with files rather than packets captured in real time. Please refer to the Working with VoIP Analyzer chapter for detailed information on how to work with this tool.
Click File => VoIP Log Viewer to launch VoIP Log Viewer. You can open as many VoIP Log Viewer windows as you wish, and each window can be used for analysis of one or several capture files.
VoIP Log Viewer can be used for loading CommView capture files in NCF format and other ones created by third party network analyzers. Additionally, it's possible to load CommView VoIP Files (NVF) into VoIP Log Viewer.
VoIP Log Viewer Menu
- Load CommView Logs – opens and loads one or several CommView capture files.
- Import Logs – allows you to import capture files created by other packet analyzers.
- Generate Report – generates a summary report for the data loaded in VoIP Log Viewer and saves it to disk. When generating a report, settings of the Reports panel located in the main window of VoIP analyzer are used.
- Clear VoIP Data – clears data in the current window.
- Close Window – closes the window.
Working with Lists in VoIP Analyzer
While the lists that display information in VoIP analyzer contain data of different natures, the style and data presentation principles explained below are shared between these lists.
By default, the lists include only the most frequently used data fields, while all other fields are hidden. To select the fields you would like to be displayed, right-click on the list header and check/uncheck the corresponding options. It's also possible to change their width and the order of displayed data fields by dragging them with your mouse.
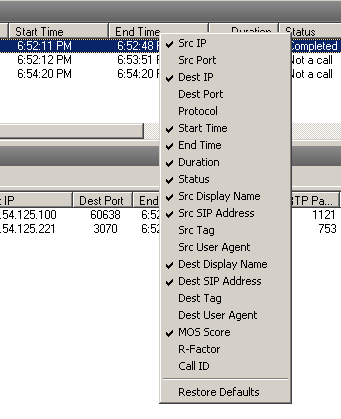
Right clicking on the list opens the context menu containing the following items:
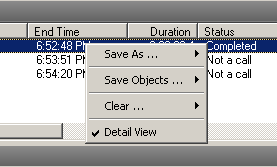
- Save As… – export all or selected records to a text file.
- Save Objects… – saves all or selected objects to a NVF file. Please see the NVF Files chapter for more information on the NVF format.
- Clear… – clears all or selected objects or lists. Deleting parent objects leads to the deletion of the child objects; for example, when deleting a SIP call, the respective RTP streams that belong to this call will also be deleted from the RTP Streams list.
- Detail View – if you are working with a master list, i.e. there are more details related to the selected object, enabling/disabling this option will make the program show/hide the respective details of object. For example, selecting Detail View on the SIP Sessions list makes the program show or hide detailed information for the selected SIP session, such as summary call information and related RTP streams.
NVF Files
VoIP analyzer allows you to save one or several VoIP data objects to a container file in NVF format. Unlike common capture files, NVF doesn't contain captured data packets. Rather, this is a set of VoIP object(s) stored in a single file. NVF files are instrumental when you want to save a VoIP call with all the related streams for future analysis.
VoIP objects that can be saved to NVF files are:
- SIP Sessions
- H.323 Sessions
- RTP Streams
To save an object to a NVF file, select one or several objects in the VoIP analyzer lists, right-click to open the context menu, and select the Save Objects As… menu item.
SIP or H.323 sessions and respective RTP streams (if any) will be saved to a file. However, if you choose to save the RTP stream, the respective parent SIP or H.323 sessions will not be saved.
You can load the saved NVF file into VoIP Log Viewer window.