RF Predictive Modeling
Predictive modeling is available to Pro License users only.
In addition to the surveys based on actual on-site measurements, TamoGraph can be used for planning WLANs that have not been deployed yet. This type of planning is called “predictive” or “virtual,” because Wi-Fi characteristics are predicted for the virtual environment model created by the user. The process of creating and adjusting the virtual environment, selection and placement of simulated APs, and analysis of the resulting WLAN is commonly referred to as “RF modeling” or “RF planning” (“RF” stands for Radio Frequency).
To create a predictive RF model, you need to:
- Create a new project with the help of the Project Wizard.
- Calibrate the floor plan or site map.
- Configure the survey options and WLAN requirements.
- Create a model of the environment. This includes placing walls and other obstructions on the floor plan, as well as placing APs and editing their properties.
To create a virtual model of the environment, the user needs to “tell” the application about the position, size, and type of the physical objects that affect radio wave propagation. Typically, walls and other obstructions, such elevator shafts, are already shown on floor plans; however, these are merely lines and dots that are meaningless to the application. The user has to draw such physical objects on top of the floor plan and define their characteristics.
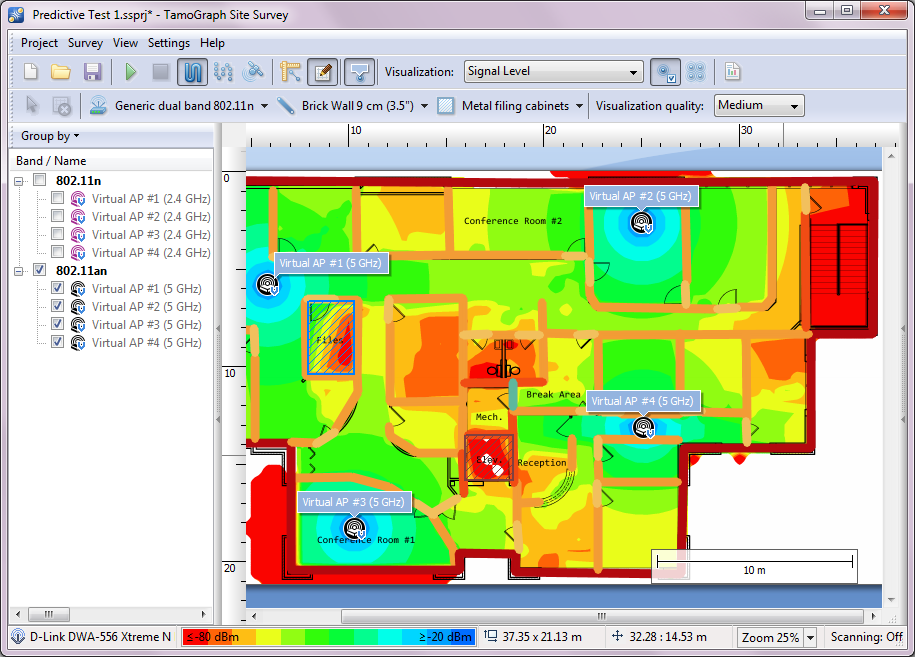
To start creating a virtual model, press the RF Planner button on the toolbar. This will show an additional toolbar with a few drawing tools. It is recommended to begin by drawing walls. Once the walls have been drawn, you can place APs on the floor plan, decide how many APs you need to provide adequate coverage, select the best positions for the APs, and configure their parameters (channel numbers, rates, antennas, etc.)
Once you have completed this process, you can analyze data as you normally do after a passive survey. If you are a novice in WLAN design, we also suggest that you read about Best Practices, Tips, and Tricks at the end of this chapter.
You must always verify that your WLAN design works as expected by conducting a real survey after deploying your WLAN. Predictive models cannot take into consideration all the factors that might affect real-world WLAN performance and therefore cannot fully substitute on-site surveys.
Remember that the accuracy of your results depends on the data you enter into the model. Ensure that you collect full business and technical requirements before you begin RF modeling. Know what types and numbers of client devices will be used, where and what applications they will use, and whether there are any mission-critical client devices that you need to consider. In addition, consider possible future changes and upgrades.
Drawing Walls and Other Obstructions
To draw a wall or other obstructions (e.g., doors or windows) on the floor plan, press the wall drawing tool button and select one of the pre-defined wall types, for example “Brick wall” or “Interior office window.” You should select the type that best matches the actual wall you are going to draw. You can also select one of the two drawing modes: Line or Polygonal path. If you selected the Line mode, left-click on the floor plan to start a new wall and left-click once again in a new location to finish the wall. A straight line representing the wall will be drawn. If you selected the Polygonal path mode, left-click on the floor plan to start a new wall and left-click every time you need to start a new line segment. This will draw a connected series of line segments. If you hold the Ctrl key (on Windows computers) or the Shift key (on macOS computers) while drawing walls, the line is drawn in orthogonal mode (0, 90, 180, or 270 degrees). If you need to cancel the previous move, right-click on the shape and select Undo Last Segment in the context menu. To finish the wall, click on the last point or press the ESC key. You can move or resize the walls that you have drawn. To move a wall, select it and drag it with the left mouse button to a new position. To resize a wall or wall segment, select it, move the mouse over the vertex (shown as a white circle), click on it, and drag it with the left mouse button to a new position.
Please note that there is no need to redraw similar obstructions manually; you can simply copy and paste objects individually or in groups. For example, you can copy a set of walls, doors, and windows from one room and paste it to another. See Copying, Pasting, and Deleting Multiple Objects for more information.
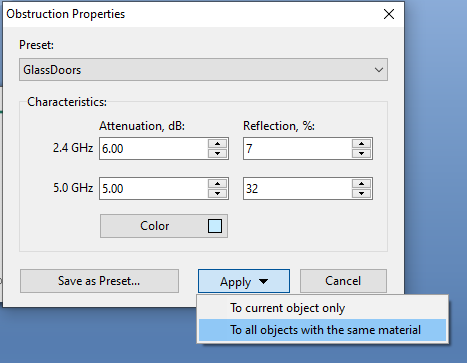
After the wall has been drawn, you can change its properties in the Obstruction Properties dialog. To display this dialog, double-click on a wall or select the Properties context menu item. In the dialog window, you can change the obstruction type by selecting one of the existing presets or modify obstruction characteristics such as attenuation, reflection, or color. Attenuation is a drop in strength measured in dB that the RF signal experiences when it passes through the obstruction. Because materials might attenuate differently at different frequencies, there are two separate attenuation values for 2.4 and 5/6 GHz. You can enter a custom attenuation value. A custom value can be obtained by measuring signal strength on each side of the obstruction and calculating the difference. Measurements can be performed using TamoGraph or any WLAN analyzer, e.g., CommView for WiFi. Reflection is a percentage of signal strength that is reflected by the obstruction at the 90° angle. Color is an arbitrary color used to show the obstruction on the floor plan. If you prefer obstructions to appear colorless (i.e., grayscale), you can configure the application to grayscale them in the Visualization Settings panel. When you have edited obstruction properties, you can save the current configuration for future use by clicking the Save as Preset button at the bottom of the dialog window.
You can also select an existing preset, modify it, and click Save to save it under the same name. To save it under a different name, change the preset name before clicking Save. Click New to create a new preset from scratch. To delete an existing preset, click Delete.
Consider creating separate custom presets for each wall or door type in your project even if they match existing presets. This allows you to change the values or colors of all similar objects with a few clicks, as shown below:
Drawing Attenuation Zones
An attenuation zone is an area where the signal strength drops over distance. This makes it different from walls and other obstructions, where the drop occurs only one time, when the signal passes through a specific object, and where the object thickness is negligible. To draw an attenuation zone on the floor plan, press the attenuation zone drawing tool button and select one of the pre-defined attenuation zone types; for example “Elevator shaft” (there is also a zone type titled “Floor Area” that is not an attenuation zone per se; we will talk about this in the Working with Multi-floor Sites chapter). You should select the type that best matches the actual attenuation zone you are going to draw. You can also select one of the two drawing modes: Rectangle mode or Polygon mode. A rectangle is defined by its top left and bottom right corners; it is aligned vertically/horizontally and cannot be rotated. Polygons consist of multiple line segments, allowing more complex shapes to be created. If you selected Rectangle mode, left-click on the floor plan to start a new zone, drag the mouse to form a rectangle, and release the left mouse button to finish. If you selected Polygon mode, left-click on the floor plan to start a new zone and left-click every time you need to start a new line segment. This will draw a connected series of line segments. If you hold the Ctrl key (on Windows computers) or the Shift key (on macOS computers) while drawing, the line is drawn in orthogonal mode (0, 90, 180, or 270 degrees). If you need to cancel the previous move, right-click on the shape and select Undo Last Segment in the context menu. To finish the zone, click on the last point, or press the ESC key, or click Done on the info panel below the floor plan. You can move or resize the zone borders that you have drawn. To move a zone, select it and drag it with the left mouse button to a new position. To resize a zone or zone segment, select it, move the mouse over the vertex (shown as a circle), click on it, and drag it with the left mouse button to a new position.
After the zone has been drawn, you can change its properties in the Attenuation Zone Properties dialog. To display this dialog, select a zone and double-click on it, or select the Properties context menu item. In the dialog window, you can change the zone type by selecting one of the existing presets or modify zone characteristics such as attenuation or color. Attenuation is a drop in strength measured in dB per meter (or foot, depending on the measurement units of your project) that the RF signal experiences when it moves across the zone. Because materials might attenuate differently at different frequencies, there are two separate attenuation values for 2.4 and 5 GHz. You can enter a custom attenuation value. A custom value can be obtained by measuring signal strength on each side of the zone, calculating the difference, and dividing it by the distance. Measurements can be performed using TamoGraph or any WLAN analyzer; e.g., CommView for WiFi. Color is an arbitrary color used to show the zone on the floor plan. If you prefer zones to appear colorless (i.e., grayscale), you can configure the application to grayscale them in the Visualization Settings panel. When you have edited zone properties, you can save the current configuration for future use by clicking the Save as Preset button at the bottom of the dialog window.
As with the material presets, you can select an existing preset, modify it, and click Save to save it under the same name. To save it under a different name, change the preset name before clicking Save. You can also click New to create a new preset from scratch. To delete an existing preset, click Delete.
Copying, Pasting, and Deleting Multiple Objects
While working on your RF model, you can copy multiple virtual objects and paste them to the current or a different floor plan. To select multiple objects, hold the Ctrl key (on Windows computers) or the CMD key (on macOS computers) and left-click on each object you would like to add to the selection. Another click on the selected object removes the selection from the given object. Clicking anywhere outside the selection unselects all objects. Alternatively, multiple objects can be selected by drawing a frame, i.e. pressing and holding the left mouse button and dragging the mouse.
If multiple objects of different type are selected (e.g., APs, walls), an additional panel is displayed below the floor plan. Using the checkboxes on that panel, users can control which type(s) of objects should be included in the selection. By default, all types of objects are included..
Once the objects have been selected, you can copy them to clipboard by pressing Ctrl + C (on Windows computers) or CMD + C (on macOS computers,) or by using the Edit => Copy context menu item. Copied objects can be pasted to the same floor plan, a different floor plan within the same project, or even to a floor plan in a different project. To paste objects, use Ctrl + V (on Windows computers,) CMD + V (on macOS computers,) or the Edit => Paste context menu item. You may need to adjust the pasted objects’ positions after pasting.
To delete multiple objects, select them as described above and press the Del key.
Undo and Redo
TamoGraph keeps track of all the changes that you make to your RF model as you work. This allows you to roll back your model to any previous state within the current editing session. This function is useful if you make a mistake and want to undo a certain action.
To access this functionality, you can use the Redo last operation and Undo last operation buttons on the RF planner toolbar. These buttons contain drop-down menus that list all previously performed editing operations. You can also use the context menu commands, Edit => Undo and Edit => Redo, as well as the keyboard shortcuts: Ctrl + Z and Ctrl + Y (on Windows computers) or CMD + Z and Shift + CMD + Z (on macOS computers).
Virtual APs Placement Methods
Two AP placement methods are available: manual and automatic. If you use the manual method, you add virtual APs and select their locations yourself. The number of APs to place, capacity considerations, signal levels, and all other WLAN requirements are the responsibility of the user. If you use the automatic method, you let the application decide where to place APs given the requirements (e.g., the number of APs needed to cover each point, client capacity, etc.). The advantage of the manual method is in its utmost flexibility: you are in full control of the process. At the same time, this method requires experience in designing WLANs and may be rather time-consuming. Automatic placement is much simpler and faster, but the output of even the most advanced algorithm may not be ideal; AP positions may still require manual adjustments. Additionally, when you manually place and configure APs, you can select different AP models and/or antenna types; with automatic placement, all the APs must be exactly the same.
Manual Placing and Configuring Virtual APs
To place an AP on the floor plan, press the AP drawing tool button and select one of the pre-defined AP types; for example, “Generic 802.11ax (2.4 GHz)” or “Generic dual-band 802.11ax.” Click on the floor plan to place an AP in a desired location. After that, you can change its properties by double-clicking on the AP or by selecting the Properties context menu item. The AP Properties dialog can be used for loading AP characteristics from one the presets, assigning a unique name to the AP, or for customizing AP characteristics. Virtual AP icons are marked with a small blue “V” in the icon corner so that you could distinguish between real and virtual APs.
To customize an AP, you can use two tabs: one for Radio #1 (typically 2.4 GHz) and one for Radio #2 (typically 5 or 6 GHz). Both of the radios can be either configured independently and use different 802.11 standard and bands, or share the same band and/or standard. The only restriction is that the 2.4 GHz band can be assigned to Radio #1 only. These tabs allow you to turn on and off these radios independently (using the Radio enabled check box) and configure the following characteristics for each of the two radios:
- Standard. Use this drop-down list to select one of the 802.11 standards. For Radio #1, select any standard in any band. For Radio #2, select any standard in any band, except for the cases where this combination mandates the use of the 2.4 GHz band.
- Channel width. If the selected standard allows channel bonding, then select one of the available channel widths: up to 40 MHz for 802.11n, up to 160 MHz for 802.11ac and 802.11ax, and up to 320 Mhz for 802.11be.
- Channel / Channel set. Select a single channel if the channel width is set to 20 MHz or a set of channels if the channel width is greater than 20 MHz.
- MAC address. You can change the MAC address to your AP. This is typically not necessary because the application always assigns unique MAC addresses to the APs.
- SSID. Use this field to assign an SSID to the AP. The same SSID may be shared by several APs.
- Power. Use this drop-down list to select the AP transmit power. Most of the APs have a transmit-power of 17 dBm (50 mW). It is always a good idea to refer to the documentation of the specific AP model you plan to deploy to find this value. Remember that transmit power might depend on the channel frequency and band.
For the APs that work in the 6 GHz band, transmit power is configured differently. The current power setting is shown on the Power button caption. When this button is clicked, an additional dialog is displayed, in which the following options are available.- Fixed EIRP. This option simply sets a fixed EIRP value, similar to how it works in the traditional 2.4 and 5 GHz bands.
- PSD Rules (FCC). This option allows you to configure AP power as per the Wi-Fi 6E FCC rules, where transmit power is defined by the Power Spectral Density (PSD). According to these rules, the total transmit power depends on the channel width and is capped from above. The FCC rules define three AP classes depending on the intended usage: Standard Power (SP), Low Power Indoor (LPI), and Very Low Power (VLP). You can select one of these predefined types.
- PSD Arbitrary. This option is similar to the previous one, PSD Rules (FCC), but gives you flexibility in setting a PSD value and maximum power limit. This option is intended for non-US users who live in countries where Wi-Fi 6E AP classes differ from the ones set by the FCC in the USA.
For a more detailed explanation of the PSD concept and AP classes in Wi-Fi 6E, please read the online resources here and here.
- HT / VHT / HE / EHT Parameters. Use this frame to control the advanced 802.11n (HT), 802.11ac (VHT), 802.11ax (HE), and 802.11be (EHT) parameters: primary channel number, number of spatial streams, short guard interval, and supported rates. The Supported Rates dialog can be used to specify the legacy and HT /VHT rates supported by the AP. It is a common practice to disable some or all of the legacy rates when you plan a WLAN for performance rather than coverage.
- Antenna. Use this frame to specify the kind of antenna used by the AP. The Select button opens the antenna selection dialog (overviewed below). With the Rotation control, you can specify the angle (in degrees) relating to the horizontal positioning of the antenna. With the Elevation control, you can specify the angle (in degrees) above the horizon, i.e., the angle by which the antenna is tilted up or down in relation to the theoretical horizon. With the Tilt control, you can specify the angle (in degrees) relating to the vertical axis, i.e., the angle by which the antenna is tilted sideways. The Height control can be used to specify the height of the AP above the floor level. The Advanced dialog provides top, front, right, and 3D views of the selected antenna diagram and can be used to adjust the antenna orientation either by rotating the diagram top, front, or right views or by entering numeric values.
When you have edited AP properties, you can save the current configuration for future use by clicking the Save as Preset button at the bottom of the dialog window.
Antenna Selection
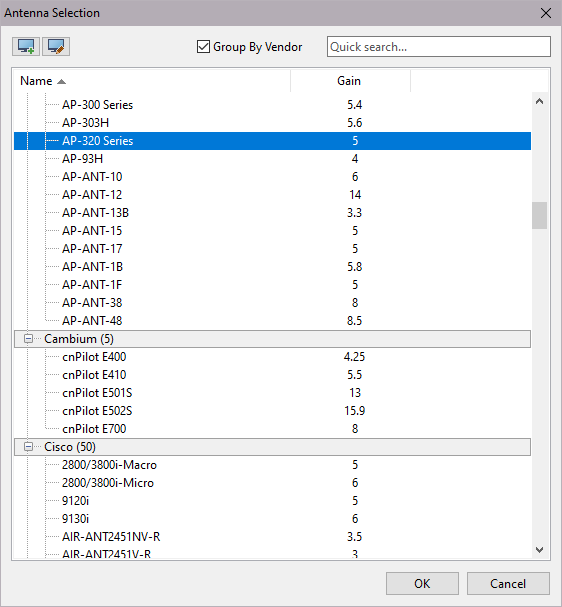
When you click Select in the Antenna frame, an antenna selection dialog is displayed. Using this dialog, you can choose from a variety of antenna models by major Wi-Fi equipment vendors or one of the generic antenna types. Each listed antenna has a name, vendor name, and gain. By default, the available antennas are grouped as follows:
- Recently Used – antennas that you have recently used in your projects. Initially, this group is empty.
- Generic Antennas – standard antenna types that are not associated with a specific vendor.
- Vendor Antennas – antennas manufactured by major Wi-Fi equipment vendors.
Checking the Group by Vendor checkbox re-groups the list by vendor name. You can use the Quick search field to find antennas that match the search string. Note that the search is performed only for vendor antennas; recently used and generic antennas are always displayed.
Advanced users may want to add their own antenna patterns or edit existing ones by clicking the New antenna and Edit current antenna buttons, respectively. This will open the AntEditor utility. Please note that this is an experimental tool, and we do not provide official support for it. Please watch Using TamoSoft Antenna Editor to learn how to use this utility.
In addition, if you want to add a new antenna pattern for a specific AP and you cannot or do not want to do this yourself, just contact our technical support and we will add your antenna pattern to TamoGraph in a matter of days. Just ensure that the AP’s radiation patterns (in graphical or numerical format) are publicly available (or available to you, in which case you should send them to us).
Adjusting Horizontal Antenna Orientation
Once an AP has been placed on the floor plan, you can change its horizontal antenna orientation without opening additional dialogs. To do that, select an AP with a mouse click; you will see a ring that surrounds the AP icon and a triangle-shaped marker that shows the direction of the antenna’s main lobe. To modify the direction, hover the mouse over the triangle and, while holding the left mouse button pressed, drag the triangle to change the antenna’s main lobe direction.
Naturally, this operation is advisable only if you are working with directional antennas, such as sector antennas. For omnidirectional antennas, rotating the antenna is not needed at all.
Creating Vendor-Specific AP Presets
As described in the previous chapter, TamoGraph allows for full customization of all virtual AP parameters. This functionality makes it possible to create virtual AP presets that match actual hardware from major AP vendors, such as Cisco, Aruba, etc.
Before we explain this procedure, we would like to answer one of the most frequently asked questions:
Why do you not add vendor-specific AP presets yourselves?
Indeed, TamoGraph includes only a few generic AP presets, because real-world, hardware APs have many configurable parameters and only you know how your AP is configured. The simplest example is an 802.11ac AP by vendor XYZ that supports 80, 40, and 20 MHz channels in the 5 GHz band. What channel width should we use to add that specific AP to the list of our presets? If we select 80 MHz channel width and you configured your real-world AP to use 20 MHz, your virtual model will be incorrect. Adding three different presets is also a bad idea because channel width is not the only configurable parameter. There are others, such as AP transmit power, channel number, etc. Therefore, you, the WLAN administrator, should create unique AP presets in accordance with your unique AP configurations. This is very easy. All AP presets consist of two parts:
- AP configuration parameters (power, channel, installation height and angles, etc.)
- Antenna preset.
This can be expressed by a simple formula:
AP Preset = AP Parameters + Antenna Preset
Yet another reason we do not add vendor-specific AP presets is that many outdoor AP models do not have integrated antennas. Instead, the user can select from a number of external antennas, which means that the same AP model may have multiple antenna options and, therefore, multiple presets.
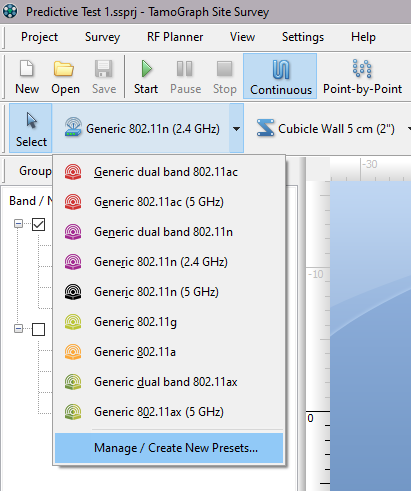
To illustrate the process, let us assume that we want to create an AP preset for a new WLAN for which we will use Aruba AP-325 access points. First, click on the Virtual APs tool on the toolbar and select Manage / Create New Presets:
This opens the Preset Manager where you can modify all the AP parameters and change the antenna type. The screenshot below illustrates a few changes we made to the default values for the 5 GHz radio to ensure that the virtual AP matches the real-world Aruba AP-325 APs that we will deploy:
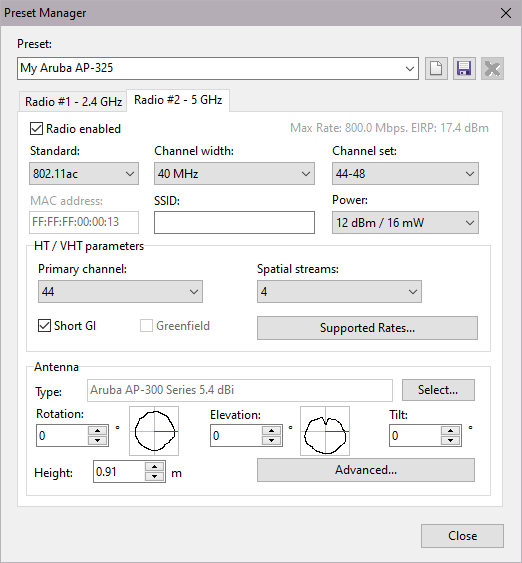
The following changes have been made:
- The preset name was changed to “My Aruba AP-325”.
- The channel width was set to 40 MHz. Although Aruba AP-325 APs support up to 80 MHz, let us suppose we will limit the channel width to 40 MHz.
- Let us imagine that this is a dense deployment, so the transmit-power was reduced to 12 dBm.
- AP-325 APs are 4x4 MIMO devices, so the default number of spatial streams was changed to four.
Finally, we need to click Select… to change the generic antenna to one that matches the AP. As mentioned above, we can choose from a variety of antenna models by major Wi-Fi equipment vendors or one of the generic antenna types. In this case, we will select the Aruba AP-320 series antenna:
If you cannot find a matching antenna, please refer to Antenna Selection, which lists a few options available to users.
You may want to click Advanced… to examine 3D views of the selected antenna diagram and to adjust the antenna orientation either by rotating the diagram views or entering numeric values.
Finally, clicking OK confirms the antenna selection. The same adjustments and antenna selection should be performed for the 2.4 GHz radio.
Clicking Save saves the new preset. The preset is now available alongside the generic presets in the drop-down list. Managing AP presets is similar to managing walls or attenuation zone presets. You can select an existing AP preset, modify it, and click Save to save it under the same name. To save it under a different name, change the preset name before clicking Save. You can also click New to create a new preset from scratch. To delete an existing preset, click Delete.
Automatic Placing and Configuring Virtual APs
Note that currently automatic AP placement functionality is implemented on a per-floor basis only. If you are working with a multi-floor project, APs from adjacent floors will not be taken into account when you run the auto-placement wizard. The wizard should be run for each floor.
Before you can auto-place virtual APs on the floor plan, you need to draw one or several areas where you plan to deploy the APs and where you want to have Wi-Fi coverage; this will determine future AP positions. You can also optionally define the number and types of WLAN clients for each area, and, finally, run the auto-placement wizard.
Drawing Deployment and Coverage Areas
To draw a deployment or coverage area on the floor plan, press the deployment or coverage drawing tool button on the RF Planner toolbar:

Select one of the pre-defined types:
- Deployment Area – the area that can be used for deploying APs. Some areas in your office might not be suitable for AP mounting, in which case you may want to draw one or several deployment areas that do not cover the areas where AP mounting is undesirable.
- Coverage Area – refers to the area where you need Wi-Fi coverage. Some areas in your office, such as bathrooms or staircases, might not need Wi-Fi coverage. In such cases, you can draw coverage areas that do not include bathrooms or staircases. If the coverage area does not overlap the deployment area, the automatic planner avoids placing APs in such “coverage-only” areas and tries to provide coverage using the APs located in the nearest deployment areas.
- Deployment and Coverage Area – when deployment and coverage areas fully overlap, you can draw the combined “deployment + coverage” area.
You can also select one of the two drawing modes: Rectangle mode or Polygon mode. A rectangle is defined by its top left and bottom right corners; it is aligned vertically/horizontally and cannot be rotated. Polygons consist of multiple line segments, allowing more complex shapes to be created. If you selected the Rectangle mode, left-click on the floor plan to start a new area, drag the mouse to form a rectangle, and release the left mouse button to finish. If you selected the Polygon mode, left-click on the floor plan to start a new area and left-click every time you need to start a new line segment. This will draw a connected series of line segments. If you hold the Ctrl key (on Windows computers) or the Shift key (on macOS computers) while drawing, the line is drawn in orthogonal mode (0, 90, 180, or 270 degrees). If you need to cancel the previous move, right-click on the shape and select Undo Last Segment in the context menu. To finish the area, click on the last point, or press the ESC key, or click Done on the info panel below the floor plan. You can move or resize the area borders that you have drawn. To move an area, select it and drag it with the left mouse button to a new position. To resize an area or area segment, select it, move the mouse over the vertex (shown as a circle), click on it, and drag it with the left mouse button to a new position.
Configuring WLAN Clients
After the area(s) have been drawn, you may want to configure the number and types of WLAN client devices that you plan to service. This step is optional. When you run the auto-placement wizard (overviewed below), you will be prompted to select one of the three WLAN planning methods: for Coverage, for Capacity (simple), and for Capacity (advanced). The number and types of WLAN client devices will be taken into account only if you use the Capacity (advanced) method. To add clients, right-click on a coverage or deployment + coverage area and select Properties or simply double-click on the area.
A Coverage Area Properties dialog will be displayed:
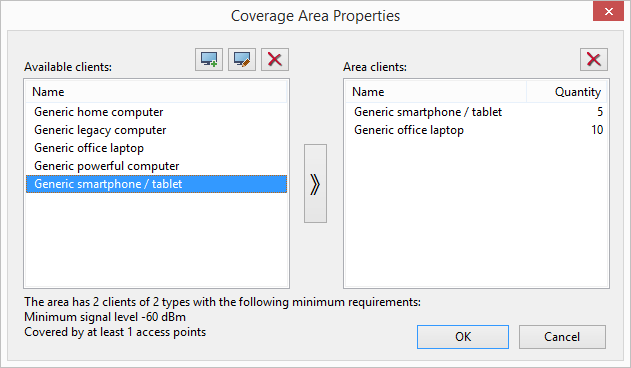
On the right side, you can see the list and number of clients that are currently configured for the given area. When you open this dialog for the first time, this list is empty. To add clients to the area, use the list on the left side: select one of the available client types and use the arrow button to move it to the right side or simply drag it to the right side. Once the new client type appears on the right side, select the item and change the Quantity value to reflect the actual number of clients that you want to service in this area.
Each pre-defined client type is associated with a number of typical applications. For example, Generic smartphone/tablet may use an e-mail client and VoIP client, but not Web browsing with access to heavy media content. To edit the applications associated with a client type, double-click on the client type or click the Edit client template button. To add a new client type, click the New client template button. The following dialog will be displayed:
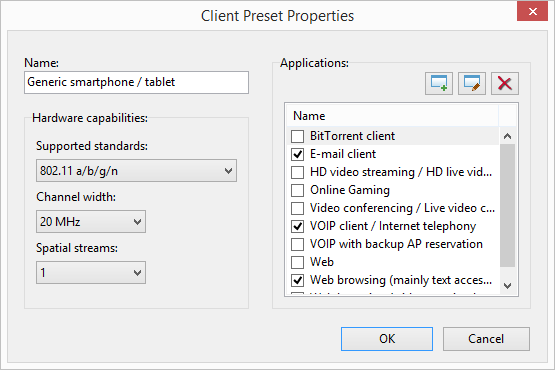
In this dialog, you can configure the Name for the client type being edited, as well as the 802.11 characteristics of the client adapter, namely Supported standards, Channel width, and the number of Spatial streams. On the right side of the dialog, you can configure typical associated Applications by checking or unchecking the corresponding checkboxes. Each application has a set of requirements that you can edit by double-clicking on the application item or by clicking the Edit application template button. To add a new application type, click the New application template button. The following dialog will be displayed:
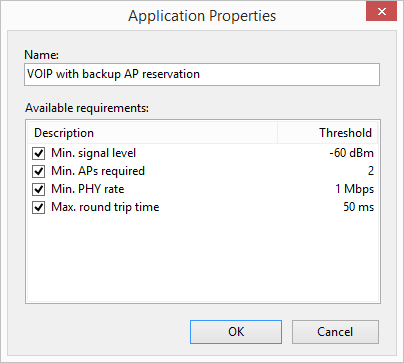
Use this dialog to configure the requirements for the selected application, or, if you are creating a new application, for a new one.
Once you have configured WLAN clients for all of your coverage areas, you can run the auto-placement wizard to place access points automatically.
Using the Auto-Placement Wizard
The auto-placement wizard is a tool for the automatic placement of access points in the predictive modeling process. It is an alternative to manual AP placement. The difference between the two is overviewed in the Virtual APs Placement Methods chapter. To run the wizard, click on the Auto-place APs button on the RF Planner toolbar. You will be prompted to select one of the three WLAN planning methods:
- Coverage – Use this option to optimize your WLAN for coverage. It is assumed that the APs' capacity is adequate for the number of clients connected to the WLAN. The wizard will try to make sure that the entire area is covered by Wi-Fi without considering the number and type of clients that will be using the WLAN. Such planning may be used for warehouses or other areas where client devices do not generate much network traffic.
- Capacity (simple) – Use this option to optimize your WLAN for capacity to provide sufficient resources for client servicing and load balancing on a site-wide basis. To proceed, you need to estimate the number of APs that will service your site and enter the estimated value into the Total number of APs to deploy field.
- Capacity (advanced) – Use this option to optimize your WLAN for capacity to provide sufficient resources for client servicing and load balancing on a per-zone basis. The wizard will try to make sure that each coverage area is covered by Wi-Fi taking into consideration the number and type of clients that you have assigned to each area. This option is most useful when you specify several coverage areas with different requirements on the same floor, such as high-density areas with applications that require high throughput and low RTT vs. areas with few clients, etc.
After clicking Next, you will be prompted to select the type of APs to be deployed. You can select from one of the presets by clicking Load Preset or use the configuration options on that page. Be sure to use the parameters, such as Power, Spatial streams, and Antenna type, that best match the actual APs that you plan to deploy. If you check Some 2.4 GHz radios can be disabled, the algorithm may turn off 2.4 GHz radios of some of your dual-band virtual APs to reduce co-channel interference while still meeting the requirements for coverage and redundancy.
One of the most important parameters to configure is the Channel width. In virtually all high-density enterprise deployments, you should use 20 MHz channels. There are very few use cases for 40 MHz channels in the 5 GHz band. Unless the use case is a small branch office or home, with clean spectrum, do not use channels wider than 20 MHz in the 5 GHz band. In the 2.4 GHz band, the rule of thumb is to never use 40 MHz channels; there is simply no room left for channel re-use in the 2.4 GHz band if you use 40 MHz channels.
The next page allows you to select specific channel plans for your 2.4 GHz, 5 GHz and 6 GHz radios.
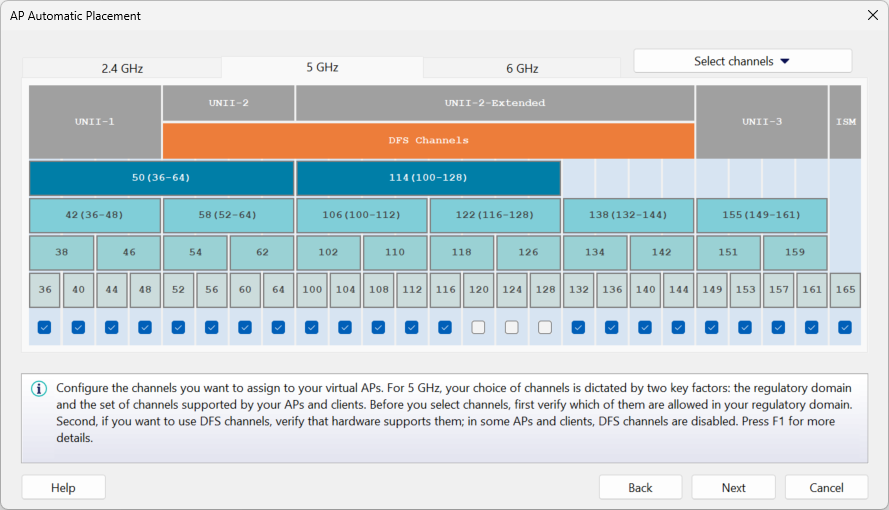
For 2.4 GHz, we recommend channels 1-6-11 in the regulatory domains where 11 channels are allowed, or 1-7-13 in the regulatory domains where 13 channels are allowed. As a backup option, you may want to use 1-4-7-11 and 1-5-9-13, respectively; however, these setups are by no means recommended, because if you use four 20 MHz channels, a channel overlap is inevitable. For 5 and 6 GHz, your choice of channels is dictated by two key factors: the regulatory domain and the set of channels supported by your APs and clients. Before you select channels, first verify which of them are allowed in your regulatory domain. Second, if you want to use DFS channels, verify that hardware supports them; in some APs and clients, DFS channels are disabled.
On the next page of the wizard, you need to specify two key Coverage requirements (note that this page is not shown if you have selected Capacity (advanced) as the WLAN planning method). The Minimum number of APs that must provide coverage in each point value is used to determine the number of APs used for redundancy and seamless roaming. The With the signal level of at least field is used to determine the minimum signal level in dBm provided by the APs in each point of the coverage area. It is important to note that the requirements may or may not be the same for the 2.4 and 5 GHz bands. For example, you may want to require -67 dBm in the 5 GHz band for your modern VoIP-enabled smartphones and tablets, but only -75 dBm for legacy 2.4 GHz devices. If you want to have the same requirements for both bands, use the chain-link button to make the requirements interlocked.
On the final page, you need to select the Computation method to be used: Standard or High precision. The first method uses a standard mathematical model for a quick AP placement computation. It is recommended for large WLANs with dozens of APs. The second method uses a much more complex model for a very detailed and precise AP placement computation. Because of the amount and complexity of mathematical computations being used in this method, the process might take a long time, especially if you are not running the program on a high-end, multicore CPU.
Click Done to begin the automatic AP placement computations. If you do not like the result, press Ctrl + Z (on Windows computers) or CMD + Z (on macOS computers) to revert to the previous state.
Reconfiguring Virtual APs
In addition to automatic AP placement for new deployments where no virtual APs have been placed (discussed in the previous chapter), TamoGraph allows you to reconfigure an existing predictive model. The purpose of such reconfiguration is to optimize the channel allocation of the existing virtual APs and/or to adjust their output power levels to make sure that yours existing virtual APs meet the new requirements. Unlike automatic AP placement discussed above, reconfiguring virtual APs does not change the APs’ positions on the floor plan.
To run the wizard, click on the Reconfigure APs button on the RF Planner toolbar. You will be prompted to select one of the following reconfiguration modes:
- Coverage requirements – reconfigures an existing predictive model to match new requirements for signal levels and the number of APs to cover the WLAN.
- Channel plan – reconfigures an existing predictive model to optimize channel assignment.
- Both – combines the two modes listed above.
The reconfiguration can be applied to all existing APs or to only a subset: use the Bands and AP Selection frame to select the Bands to reconfigure as well as to indicate whether you want to work with All APs or only Selected APs.
After clicking Next, you will be prompted to select Coverage requirements (if you have chosen that reconfiguration mode). The Minimum number of APs that must provide coverage in each point value is used to determine the number of APs used for redundancy and seamless roaming. The With the signal level of at least field is used to determine the minimum signal level in dBm provided by the APs in each point of the coverage area. To reduce co-channel interference, the algorithm may adjust the output power of the APs to be placed. Use the Minimum AP power and Maximum AP power drop-down lists to set the constraints of such adjustments. If the Minimum AP power is set to Power off, the algorithm may turn off the corresponding radio completely. If you prefer to not have the power level adjusted, set Minimum AP power and Maximum AP power to the same value equal to the AP’s default output power. If you prefer to avoid any intermediate power level and would rather have the radio either fully turned off or work at the default power level, check the Don’t allow intermediate power levels box. It is important to note that the requirements may or may not be the same for the 2.4 and 5 GHz bands. For example, you may want to require -67 dBm in the 5 GHz band for your modern VoIP-enabled smartphones and tablets, but only -75 dBm for legacy 2.4 GHz devices. If you want to have the same requirements for both bands, use the chain-link button to make the requirements interlocked.
On the next page, you will be prompted to select a Channel plan (if you have chosen that reconfiguration mode). For 2.4 GHz, we recommend channels 1-6-11 in the regulatory domains where 11 channels are allowed, or 1-7-13 in the regulatory domains where 13 channels are allowed. As a backup option, you may want to use 1-4-7-11 and 1-5-9-13, respectively. However, these setups are by no means recommended, because if you use four 20 MHz channels, a channel overlap is inevitable. For 5 GHz, your choice of channels is dictated by two key factors: the regulatory domain and the set of channels supported by your APs and clients. Before you select channels, first verify which of them are allowed in your regulatory domain. Second, if you want to use DFS channels, verify that hardware supports them; in some APs and clients, DFS channels are disabled.
Click Done to begin the AP reconfiguration process. If you do not like the result, press Ctrl + Z (on Windows computers) or CMD + Z (on macOS computers) to revert to the previous state.
Working with Presets
Presets are pre-configured sets of values for APs, walls, and attenuation zones (and, additionally, for floors/ceilings, if you work with multi-floor sites). Presets can be accessed via the Manage Presets menu item available in the corresponding drop-down menus for each of the three object types. At the top of the preset management dialog, you can see a drop-down list populated with existing presets. You can select an existing preset, modify it, and click Save to save it under the same name. To save it under a different name, change the preset name before clicking Save. You can also click New to create a new preset from scratch or delete an existing preset by clicking Delete
Applying Visualizations
Data analysis for predictive models is very similar to data analysis for passive surveys; it is described in detail in the Analyzing Data – Passive Surveys and Predictive Models chapter. In brief, you simply need to select a visualization from the drop-down list on the toolbar. However, in case of predictive models, you can also control the Visualization quality by using the corresponding control on the toolbar. Visualization quality is an important parameter that defines how precise the calculations are. High-precision calculations come at a cost: the higher the precision, the longer the computation time. The application offers four quality presets: Low, Medium, Good, and Best. They differ in grid size and in applying advanced RF propagation effects, such as reflection and Fresnel zones. We suggest that you use low or medium visualization quality while you design your WLAN and make adjustments to your design. When the design is ready, you can use good or best visualization quality for the final verification and/or report generation.
Calculating RF propagation is a very CPU-intensive task that might take a long time for large floor plans with many APs. It is recommended that you use a fast multicore CPU, such as Intel i7, because in this case the application could take advantage of parallel computations that are possible on multicore CPUs. It is also recommended that you split large floor plans into smaller parts if computing visualizations takes too long.
Working with Multi-floor Sites
When a WLAN for a multi-floor building is being designed, the virtual model must take into consideration signal “leak” from the adjacent floors. This is important for two reasons. First, it is a common practice to provide connectivity to the adjacent floor by means of the APs that are deployed one floor below or above (usually below, because APs are typically placed on the ceiling, and, therefore, are closer to the floor located above.) Second, if providing connectivity by this method is not planned, it is important to make sure that the signal that penetrates the floors does not cause interference. With TamoGraph, you can create and analyze multi-floor models as explained below.
Creating a Multi-floor Project
To create a multi-floor project, you should first follow the same steps that you follow to create a standard project; you must add a floor plan to the project and calibrate it. You can begin with the first floor. Once a standard project with a single floor plan has been created, you can use the Plans and Surveys tab on the right panel to manage floors and define their characteristics. Floors define the building’s vertical structure. Floor maps within each floor contain images of the floor plans. Click Add => Floor to create a new floor level. If this is the first time you have added a floor to the project and the project already contains previously added floor plans, you will be prompted to move the existing floor plans to the newly created floor. You can also do this later, by dragging the floor plans to the new floor.
After that you can click Add => Floor again to create a new floor level. If the floor plans are identical for all the floors in your model, you can duplicate floors after drawing walls and other obstructions on the first floor plan and placing alignment points; this is described in detail below. If the floors are not identical, you should add individual floor plans images in one of the supported graphic formats for every floor by selecting the corresponding floor and using the Add => Plan… command. New floor plans must then be calibrated. Note that for each floor, you can add multiple floor plans that might have different scale and orientation.
Once the floors have been created and the corresponding floor plans have been added and calibrated, you should specify floor heights and a few other characteristics. New floors are added with default floor materials and heights; to specify correct values for your building, right-click on any of the floor items and select Properties or click on the Floor Manager button. You can also use this dialog to rearrange floors.
Use the Add Roof button to add a roof on top of all floors. You can specify the material reflection and attenuation of the roof in the Floor/Ceiling Properties window accessible via the Modify… button. Once you have defined the floor and roof properties, address floor plan alignment as explained below.
Aligning Floors
When you work with a multi-floor site model, TamoGraph can analyze Wi-Fi signals that come from the adjacent floors. To be able to take advantage of this functionality, you need to perform floor alignment. Floor plan alignment is necessary because floor plans might have different scale, orientation, or offset. While floor alignment is not mandatory, TamoGraph will use only the data from the current floor unless you perform floor alignment. To perform it, please do the following:
- Right-click on the first floor plan and select Align Floor Plan.
- Choose a few locations on the floor plan that will be easily identifiable on the plans of other floors. This could be elevator shaft corners, building corners, staircase corners, or anything else that you can easily find on all the floor plans that you use in the project.
- Click Add point to place a new marker on the floor plan, and then move the marker to one of these locations. Create at least two markers. Each marker is assigned a unique number. If you made a mistake, click Delete point or Clear all.
- Once you have placed two or more alignment markers, click Apply.
- Repeat this operation for all the floor plans that you would like to have aligned. The markers must be positioned exactly below or above the corresponding markers on the adjacent floor. For example, if marker #2 on the 5th floor is placed in the bottom right corner of the building, marker #2 must be also placed in the bottom right corner of the building on the floor plan of the 6th floor.
To check the current floor alignment status, select Properties or click on the Floor Manager button. The floors that are properly aligned are marked with a green checkbox. The floors that have not been aligned yet are marked with a yellow exclamation mark. Just like map calibration, floor alignment must be done only once.
Floor Duplication
If the floor plans are identical for some or all the floors in your model, you can simply right-click on the first floor and select Duplicate Floor to create a copy of the first floor with exactly the same floor plan. If the walls and other obstructions, their placement, and materials are identical for all floors, you can calibrate a single floor plan, draw walls, perform floor alignment as described above, and then use the Duplicate Floor command; that way, you will not need to recreate the same virtual floor model for every floor or align the floors, because duplication includes the walls and alignment points. You can select which object types should be copied to the new duplicate. By default, all objects except virtual APs will be copied.
Dealing with Complex Floor Structures
When you use a floor manager to specify the materials that separate floors, you assume that each floor is a contiguous piece of material that covers the entire floor plan area. However, there are cases that are more complex. For example, one can find buildings that have “holes” in the floors that span one or several stories. To deal with such virtual models, you should use the “Floor Area” drawing tool; it is grouped together with attenuation zones and can be found in the corresponding drop-down list on the RF Planner toolbar, next to the “Elevator shaft” or “Filing cabinet” items. Floor areas are drawn just like other attenuation zones, using Rectangle or Polygon mode. As soon as you have drawn the first floor area on a given floor, the application will assume that the floor has a non-standard geometry and only those areas that are covered with “Floor area” contain floor material; areas that are not covered are considered free from any obstructions.
To avoid unnecessary clutter, floor areas are hidden by default. Their visibility can be turned on and off in the View => Virtual Objects => Floor Areas menu. We recommend hiding floor areas once you have completed the design of your virtual model. Additionally, for the sake of clarity, it should be mentioned that when you edit floor areas, you are editing the floor below your feet, not above your head. It should also be mentioned that the floor material and its properties are configured on the Floor Manager, as discussed in the previous chapters.
Zero Attenuation Obstruction Material
A special radio-transparent floor/ceiling material can be assigned to a floor to create additional levels where you need to visualize coverage but that do not have a physical floor or ceiling. Such levels can be useful when you have obstructions like storage shelves or partial walls whose height is lower than the ceiling, or when you need to analyze coverage at multiple levels above the floor in a tall warehouse.
Analyzing Data
Data analysis for multi-floor sites is similar to data analysis methods for single-floor predictive models; they are described in the Applying Visualizations chapter. However, there are some peculiarities that should be noted. In addition to the signals from the APs located on the floor being analyzed, TamoGraph will also analyze the signals that penetrate from the APs located on the adjacent floors, taking into account their position, height above the floor, and the material of the ceilings. The APs located on the adjacent floors are displayed on the AP list (the left pane of the main TamoGraph window), but the names of such APs are shown using a pale blue font color. This allows you to identify the APs that do not belong to the current floor. Note that you cannot change the properties of such APs or delete them. If you want to change properties of an AP or delete it, first select the floor to which it belongs using the Plans and Surveys tab.
Mixing Real and Virtual Data
There are situations when you may want to combine data collected during a passive on-site survey with the data that you get from predictive models. For example, after performing a passive survey, you might find out that some areas on your floor plan lack good signal coverage. To determine the number and best placement of additional APs, you can use virtual APs. Simply place them on the floor plan, draw obstructions to get a realistic RF propagation picture for your environment, and select one of the visualizations to see the results; data from both real and virtual APs will be mixed.
If you no longer need data from virtual APs in your project, you do not have to delete them one by one. You can simply click RF Planner => Virtual Model to show or hide all virtual APs and other objects used in predictive models. This will also exclude influence from virtual APs on all visualizations.
Best Practices, Tips, and Tricks
Designing WLANs is a complex task that requires a thorough understanding of the underlying technology and design principles. If you are new to WLAN design and deployment, we strongly recommend that you read a good book on this topic, such as The Certified Wireless Design Professional Official Study and Reference Guide. Additionally, consider the following tips and tricks.
- Just because your AP's maximum output power can be set to 17 or 20 dBm does not mean that it should be set to this value. You should consider the fact that most Wi-Fi client devices, such as laptops, tablets, or desktops with Wi-Fi adapters, have a lower output power, typically 13 or 15 dBm. As a result, a client might “hear” a 20 dBm AP from a very long distance, but the AP might not “hear” the client. Additionally, APs with high output power create unnecessary interference with other APs in dense WLAN environments. If you design your WLAN for performance rather than coverage, you will probably want to have a rather dense placement of APs. Here, stronger does not necessarily mean better. You might consider lowering the power level so that it matches the power level of client devices.
- If you design your WLAN for coverage rather than performance, using high AP output power might be acceptable. However, be sure to read the AP specifications to find out the actual power level it can provide. Remember that the maximum allowed power level might be different for different channels!
- Signal level does not tell you the whole story. Consider an 802.11n AP operating in the 2.4 GHz band with the standard omnidirectional antenna and the default 17 dBm output power placed on a map with no obstructions. If you select the Signal Level visualization, TamoGraph will draw a very large (a few hundred meters) circle around your AP. Does this mean that the whole area can be considered to be covered by the AP? Of course not, because, for example, at the distance of approximately 300 meters the signal level would be about -90 dBm. Yes, the signal is there; your client device might even detect the AP and display it on the list of available networks; but there would be no connectivity. First, because the AP might not “hear” the client, as explained before. Second, even marginal connectivity requires the signal-to-noise ratio of at least 4 dBm. Considering that the typical noise level in the 2.4 GHz band in urban areas is about -90 dBm, the signal level must be at least -86 dBm. At that level, the client might be able to connect, but the throughput would be extremely poor. That said, the Expected PHY Rate or AP Coverage Areas visualizations might be much more informative than the Signal Level visualization. TamoGraph does not draw the signal level if the difference between it and the noise level is below 4 dBm.
- It is a common practice nowadays to use the 2.4 GHz band for legacy, low throughput devices and the 5 GHz band for newer, high throughput 802.11n, 802.11ac, or 802.11ax devices. When you put a dual-band AP on the floor plan, both the 2.4 GHz and 5 GHz radios are enabled by default and both are selected on the AP list on the left panel of the main application window. This means that the Signal Level or Expected PHY Rate visualizations will show you cumulative pictures; if more than one radio is included in the visualization, they will show the values for the strongest AP. However, you will probably want to estimate coverage and expected PHY rates for each band individually, because the range of 5 GHz radios is shorter and because the attenuation level for 5 GHz signals is higher. To do that, press the Select APs button on the toolbar and use the checkboxes next to the APs to select and deselect them individually. You can also group APs by band and then select or deselect all 5 GHz or 2 GHz APs with a single click. You might notice that while good coverage is available in the 2.4 GHz band in the entire area, 5 GHz coverage is not available everywhere.
- Selecting the right antennas for your AP might considerably increase signal level, decrease interference, and, therefore, improve performance. If the antennas of your APs are replaceable, this adds another degree of freedom to your WLAN design. Using TamoGraph, you can select an antenna from a large collection of generic and vendor-specific antennas. You can also view antenna patterns in 3D.
- If in doubt, you can create several copies of the same floor using different AP and antenna models and see which results best suit your requirements and budget.