


Search
TamoGraph Site Survey Guide: Choose the Right Survey Type and Prepare Your Project
Choose the right TamoGraph survey or RF modeling approach, understand what it is for, and know what to prepare before you begin.
TamoGraph helps you plan, measure, evaluate, troubleshoot, and improve Wi-Fi networks in real buildings and environments. The goal is not the project file itself. The real goal is a working WLAN in the physical environment: a network that delivers the required coverage, quality, and performance for the users and devices that matter at that site.
How to Use This Guide
This guide helps you choose the right starting approach and prepare the information, hardware, and assumptions needed before work begins. It does not replace the TamoGraph manual, describe every GUI step, or prove that a WLAN meets project requirements. When you need exact configuration steps, survey procedures, report behavior, or GUI-specific details, use the relevant manual sections.
Terms Used in This Guide
|
Term |
Meaning in this guide |
|
Wi-Fi project |
The real-world task: design, validation, troubleshooting, or improvement of the WLAN. |
|
TamoGraph project file |
The software file that contains maps, survey data, RF model data, settings, and visualizations. |
|
Output / evidence type |
The kind of result produced: measured data, predicted model, spectrum view, or combined analysis. |
|
Requirements / design criteria |
Measurable targets that may be configured and evaluated in TamoGraph. They do not necessarily represent all business, contractual, or operational acceptance criteria. |
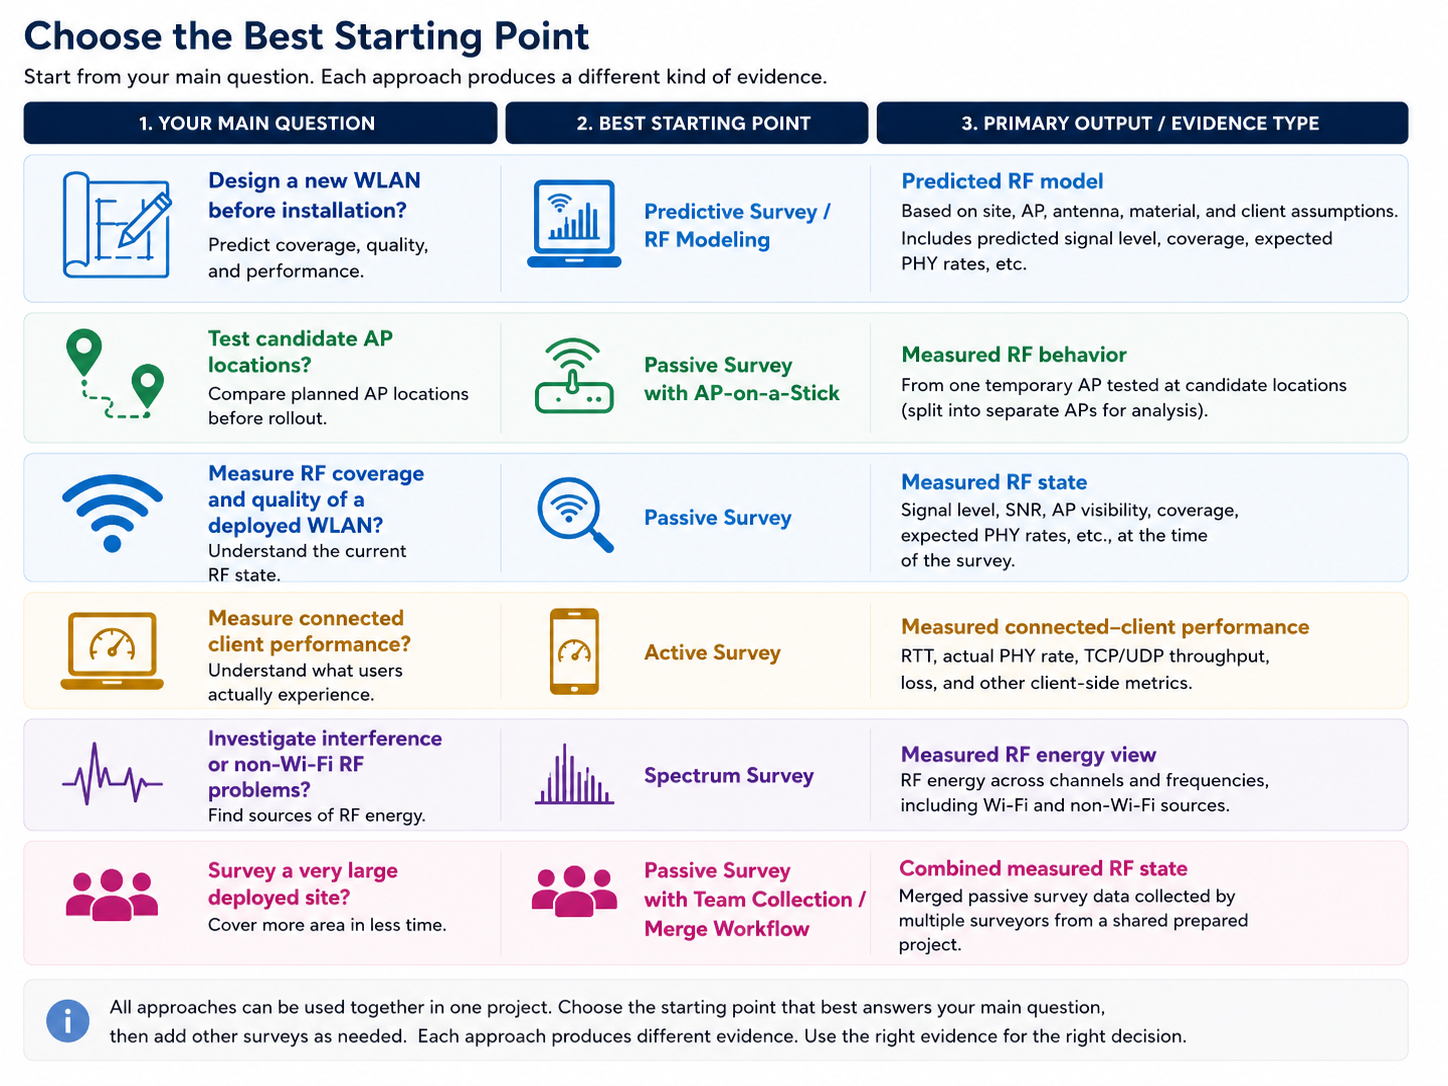
1. Choose the Best Starting Point
Different survey types and approaches answer different questions. Before choosing the first move, decide what kind of question you are trying to answer and what kind of output or evidence you need.
|
Your Wi-Fi Question or Task |
Best Starting Point |
Primary Output / Evidence Type |
Add Later / Important Limits |
|
Design a new WLAN before installation |
Predictive Survey / RF Modeling |
Predicted RF model of the future WLAN based on site, AP, antenna, material, and client assumptions |
AP-on-a-Stick if candidate locations need to be tested physically. Passive and Active validation later, after deployment. |
|
Choose or confirm candidate AP locations before rollout |
Predictive Survey / RF Modeling or Passive Survey with AP-on-a-Stick |
Predicted design options or measured RF behavior from one temporary AP tested at candidate locations |
Predictive modeling helps compare options quickly; AP-on-a-Stick provides measured pre-deployment RF data. Neither replaces final post-installation validation. |
|
Measure RF coverage and quality of a deployed WLAN |
Passive Survey |
Measured RF state of the WLAN at the time of survey, including signal level, SNR, AP coverage, expected PHY rate. |
Add Active Survey for connected-client performance. Add Spectrum Survey if RF interference or non-Wi-Fi energy is part of the question. |
|
Measure connected-client performance |
Active Survey |
Measured connected-client behavior, such as associated AP, TCP/UDP throughput with QoS, actual PHY rate, RTT, and loss |
Add Passive Survey for RF coverage and quality. Add Spectrum Survey for RF interference. Active Survey alone does not explain every RF cause. |
|
Investigate interference or non-Wi-Fi RF problems |
Spectrum Survey |
Measured RF energy view, including Wi-Fi and non-Wi-Fi sources |
Add Passive or Active Survey to understand how the WLAN is affected. A spectrum analyzer cannot perform a Passive or Active Survey by itself. |
|
Evaluate a deployed WLAN against defined requirements or design criteria |
Passive Survey and/or Active Survey |
Measured results compared with configured requirements or design criteria where applicable |
Spectrum Survey may be needed if interference is part of the problem. Broader business, contractual, or operational acceptance criteria may need to be tracked separately. |
|
Survey a very large deployed site |
Passive Survey with team collection / merge workflow |
Merged passive survey data collected by multiple surveyors from a shared prepared project |
Requires shared preparation, divided areas, consistent project copies, and a merge plan. Add Active or Spectrum Survey if performance or interference must also be evaluated. |
In the TamoGraph manual and GUI, RF modeling is called a Predictive Survey. Users may also describe it as Predictive Modeling or RF Modeling, so this guide uses these terms together.
2. Before You Choose, Define the Goal
Before creating a project, make sure you know:
- whether the WLAN already exists;
- whether the main question is about coverage, quality, performance, or interference;
- what type of environment this is;
- which users, devices, and applications matter most;
- what success should look like.
Typical goals include:
- designing before deployment;
- evaluating a deployed WLAN against requirements or design criteria;
- troubleshooting an existing problem;
- improving or redesigning an existing WLAN.
Typical environments include offices, warehouses, hospitals, schools, industrial facilities, retail spaces, and various outdoor areas. Typical devices include laptops, phones, tablets, barcode scanners, VoIP handsets, medical or industrial handhelds, and IoT devices.
Why Environment Understanding Matters
Before choosing a survey type or RF modeling approach, understand the environment well enough to make a good decision.
Important questions include:
- Is this indoor or outdoor? Multi-floor?
- Is the area open, partitioned, or busy?
- Are there walls, shelving, machinery, reflective surfaces, long aisles, or heavy obstructions?
- Does the environment change during normal operation?
- Are there many people, moving equipment, or IoT devices that affect how the WLAN is actually used?
Weak understanding of the environment increases the risk of choosing the wrong survey type, using weak assumptions, misreading the output, and creating avoidable rework later.
What Success Looks Like
Try to define success in practical terms before you start. For example, success might mean:
- reliable connectivity in the areas that matter most;
- enough coverage and quality for the target devices, including the most important or least capable devices;
- performance that is good enough for the applications used at the site;
- interference low enough not to disrupt normal operation;
- meeting the project’s defined requirements or design criteria.
For many projects, part of success can be expressed in TamoGraph as requirements or design criteria, such as signal level, SNR, throughput, loss, or other measurable targets. These criteria help evaluate measured or predicted WLAN performance in the relevant areas. Other success criteria, such as business acceptance, user sign-off, installation constraints, or operational policy, may remain outside TamoGraph and should be tracked separately.
Detailed requirements and success criteria:
https://www.tamos.com/htmlhelp/tg/configuring_tamograph.htm
3. Understand the Main Survey Types and Approaches
Passive Survey
The name passive refers to passive, listen-only mode, in which the signal is captured while the adapter is not associated with any WLAN and is dedicated only to the monitoring task.
A Passive Survey shows what the existing WLAN looks like in the real environment at the time of the survey: signal level, SNR, AP visibility, and coverage.
Besides a standard Passive Survey, in which one user walks through a site and measures the signal from a site with many installed APs, there are also:
- Passive Survey with AP-on-a-Stick: You place one real AP at each candidate location, perform a passive survey around it, and repeat this for the other planned locations. After the AP-on-a-Stick survey is complete, TamoGraph can split the measurements into separate APs for analysis, as if they came from different APs at different locations.
- Team Passive Survey: Multiple surveyors collect passive data in different areas using copies of the same prepared project, then merge the results.
Learn more:
https://www.tamos.com/htmlhelp/tg/performing_a_site_survey.htm
Active Survey
An Active Survey means that the adapter used for the survey is actively transmitting data while measuring performance. You connect as a client and generate test traffic or run ping-based checks as you move through the site.
The output is measured connected-client behavior, such as RTT, PHY rate, TCP and UDP throughput, and loss.
An Active Survey requires more setup than a Passive Survey. In Simple Mode, the survey client sends pings to a reachable host on the wired side of the network. In Advanced Mode, you need a wired-side host running TamoSoft Throughput Server.
Learn more:
https://www.tamos.com/htmlhelp/tg/performing_a_site_survey.htm#Active_Survey_Configuration
https://www.tamos.com/htmlhelp/tg/analyzing_data_-_active_surveys.htm
Predictive Survey / RF Modeling
Use this when the WLAN does not exist yet, or when you want to compare design options before making physical changes. In the TamoGraph manual and GUI, this work is called a Predictive Survey. In practice, users may also call it Predictive Modeling or RF Modeling.
You build a virtual model of the site, place or configure virtual APs, and get a predicted view of how the future WLAN is expected to behave if the design assumptions are correct. The quality of the output depends heavily on realistic assumptions about the environment, walls and their attenuation, AP placement and mounting options, antennas, and related RF conditions.
You also need to know the usage scenarios, the applications used by the client devices, and the least capable devices that may define the design limits. TamoGraph allows you to define and use those parameters for automatic Virtual AP placement; of course, you can place or adjust Virtual AP locations manually as well.
Learn more:
https://www.tamos.com/htmlhelp/tg/rf_predictive_modeling.htm
Spectrum Survey
Use this when you suspect RF interference, spectrum congestion, or non-Wi-Fi energy in the environment. You need a compatible spectrum analyzer that can report raw RF energy spread across the frequencies used for Wi-Fi:
https://www.tamos.com/products/wifi-site-survey/spectrum-analyzer
A Spectrum Survey answers a different question from a Passive or Active Survey: it shows what is happening in the RF environment itself, as non-Wi-Fi devices may affect Wi-Fi performance. Spectrum results can be viewed live or recorded during a survey.
Learn more:
https://www.tamos.com/htmlhelp/tg/spectrum_analysis.htm
Compatible Survey and Modeling Combinations
TamoGraph supports several combinations in the same project:
- Passive + Active surveys can be performed simultaneously when the required adapter setup is available. The visualizations are separate for each type.
- Passive + Spectrum surveys can be performed simultaneously when supported Wi-Fi adapters and supported spectrum analyzers are available.
- Predictive Survey / RF Modeling can be used on the same map or floor as measured survey data.
- Passive Survey and Predictive Survey / RF Modeling share the same visualization types; you can switch between measured and modeled data sources where applicable.
4. Common Mistakes When Choosing a Starting Point
- choosing a starting point before defining the project goal;
- using an Active Survey when the real question is coverage;
- using a Passive Survey when the real question is application performance and roaming tests;
- treating Predictive Survey / RF Modeling as final proof;
- forgetting that a spectrum analyzer cannot perform a Passive or Active Survey;
- treating AP-on-a-Stick as a hidden editing trick instead of a field workflow;
- starting a Team Passive Survey without a shared preparation and merge plan;
- underestimating the effect of environment type and usage assumptions on the quality of the output.
Some mistakes lead to technically correct work that still does not answer the real question. Others can lead to impossible combinations, invalid assumptions, incomplete evidence, or avoidable rework later.
5. What to Prepare Before You Begin
A successful TamoGraph project depends on more than installing the software. Different survey types and approaches require different inputs, hardware, and preparation.
Before starting, make sure you have:
- a usable floor plan or site map;
- enough understanding of the environment;
- compatible hardware for your chosen approach;
- a clear goal and success criteria;
- enough knowledge about users, devices, applications, and assumptions.
Site Information and Map Preparation
Gather the best site information you can, including:
- a floor plan, site map, or drawing;
- a basic understanding of the layout;
- if available, information about the current or planned WLAN.
Your map must be good enough for reliable calibration, meaningful survey paths and AP placement, and correct interpretation of the site layout.
Detailed map preparation and calibration guidance:
https://www.tamos.com/htmlhelp/tg/performing_a_site_survey.htm
Environment, Usage, and Design Assumptions
Before you start, define at least the basics:
- which users, devices, and equipment matter most;
- which applications matter most;
- whether IoT devices are important;
- what level of coverage or quality is expected;
- whether performance or interference is part of the question;
- what would count as success;
- which devices are the least capable and, at the same time, the most important for design decisions.
For Predictive Survey / RF Modeling, assumptions about walls, attenuation, AP placement, antenna type, mounting height, environment type, and device capabilities are especially important.
For AP-on-a-Stick, the temporary setup should match the intended final setup as closely as practical; the height and antenna orientation are very important to record.
6. Short Readiness Checklist
This is a readiness check, not a workflow.
General
- I know the Wi-Fi problem I am trying to solve.
- I know which survey type or RF modeling approach I will start with.
- I understand the environment well enough to choose and interpret the approach correctly.
- I have a usable map or floor plan.
- I know which users, devices, equipment, or applications matter most.
- I know the most important requirements or success criteria.
Passive Survey
- I have a compatible Wi-Fi adapter, have installed the drivers, and have tested passive mode.
- I have physical access to the survey area.
- If I am using AP-on-a-Stick, I have the AP, antenna setup, mounting hardware and plan, and candidate locations.
- If this is a Team Passive Survey, we have a shared project, divided areas, and a merge plan.
Active Survey
- My survey adapter can connect to the target WLAN.
- I have a reachable host on the wired side of the network.
- If needed, I have a host ready to run TamoSoft Throughput Server.
Predictive Survey / RF Modeling
- I have reasonable wall, attenuation, AP, and antenna assumptions.
- I understand the environment and WLAN usage scenarios.
- I know which users, devices, equipment, IoT endpoints, and applications matter most.
- I know which devices are least capable and therefore most important for design decisions.
Spectrum Survey
- I have supported spectrum analysis hardware.
The purpose of this checklist is to confirm readiness before work starts, not to describe the later workflow step by step.
7. Final Checkpoint
Before you proceed, make sure this statement is true:
We know what Wi-Fi problem we are solving, which survey type or RF modeling approach fits it, and what inputs, hardware, environment knowledge, and assumptions we need to get started correctly.


