Performing a Site Survey
To perform a WLAN site survey, you need to
- Create a new project with the help of the Project Wizard.
- Calibrate the floor plan or site map.
- Configure the survey options and WLAN requirements.
- Collect wireless data by walking along the planned survey path and periodically marking your location on the map or using a GPS receiver. If you perform predictive modeling, you do not need to collect wireless data. Rather, you need to create a virtual environment. See the chapter on predictive modeling for more information.
The following chapters describe these steps in detail. Additionally, be sure to read Best Practices, Tips, and Tricks to learn how to make your site surveys fast, efficient, and accurate.
New Project Wizard
To create a new project, click Project => New. A wizard window will appear.
Step 1
Specify the Name, Description (optional), and Project path. The name you give to the project is used as the file name under which your project will be saved in the folder specified in the Project path field.
Step 2
In this step, you should Select an environment. The Environment panel allows you to configure some of the very important project parameters that affect the way data visualizations are computed. Because different environments have different characteristics in terms of signal attenuation, diffraction, reflection, etc., you are asked to select the environment that best describes the site you plan to survey. For each environment, the application recommends a Guess range. A guess range is the diameter of the circle for which the application predicts the WLAN characteristics with a high degree of certainty. For passive surveys, TamoGraph can also compute WLAN characteristics outside the guess range zone, although such computations have a lower degree of accuracy. Check the Extrapolate data beyond the guess range box to enable such computations. Enabling this option means that data visualizations will cover the entire map rather than the areas that you actually surveyed. Enabling this option is not recommended unless you cannot survey some areas of the map for whatever reason. Finally, the Measurement units control can be used to choose the preferred units (feet or meters) for displaying distances and coordinates throughout the application. See the Environment chapter for more information.
Step 3
Select the Channels to scan. The application scanner sweeps through the channels supported by the wireless adapter to collect and analyze packets being sent on the selected channels. You may want to modify the channel selection if you know that some of the channels supported by the wireless adapter are not used in your WLAN or in your country. For example, if your WLAN does not use the 5 GHz band, you may want to turn off all 5 GHz channels; this will shorten the scanning cycle and, therefore, increase the data accuracy. However, please keep in mind that skipping some of the channels may result in the application's inability to detect sources of interference, such as neighboring APs that work on the channels that were skipped. It is recommended that you not modify the default Scan interval and Use the same interval for all channels settings at this stage. See the Scanner chapter for more information. You can use the Select channels button for selecting or deselecting all channels, as well as for selecting channels based on the country- or region-specific allowed channel lists (e.g., choosing United States will select channels 1-11 and deselect channels 12-14 in the 2.4 GHz frequency band).
This wizard step is skipped if your computer is not equipped with a compatible wireless adapter. You might still want to create projects on such computers if you plan to conduct active surveys or use the survey job splitting—i.e., if the data collection process is performed on other computers and the collected data is then merged on your computer.
Step 4
In the final step, you should add an image file that contains the floor plan or site map of the facility or area that you want to survey (you will be able to add more images if your project includes several zones or floors later.) A floor plan or site map is required for accurate data analysis. If no image file is available, you may want to scan a plan, if it exists on paper, create one using a drawing program, such as CorelDraw, or even make a sketch using a ruler and pencil and then scan the sketch (be sure to follow the proportions). The image file should be between 250 and 2,500 pixels on a side (naturally, this applies to raster formats only; vector images, such as DWG, do not have pixel dimensions). Larger images will slow down the application. The following image file formats are supported on Windows: BMP, PNG, JPG, GIF, WMF, TIFF, PDF, DWG, DXF, and SVG. The following image file formats are supported on macOS: BMP, PNG, JPG, GIF, TIFF, PDF, DWG, DXF, and SVG.
If you add an AutoCAD image (DWG or DXF), an additional import settings dialog is displayed. This dialog allows you to select a layout to be used (if the file contains multiple layouts) and include or exclude specific layers. For example, you may want to exclude the plan legend. You can also crop the floor plan to define a specific zone to be used for surveying.
The application also supports PDF files. When you use a PDF file, an additional import settings dialog is displayed. This dialog allows you to select a page to be used (if the file contains multiple pages). Alternatively, you can use any of the images embedded into the PDF file; such images are listed on a separate tab. You can also rotate or crop the floor plan to define a specific zone to be used for surveying.
If you plan to perform a large-area GPS-assisted survey, you may want to import a map from one of the online map services. Click Load Street Map to open a new map loader dialog. Once the initial map view is loaded (the application will try to guess your location based on the Wi-Fi environment), you can navigate to the area you want to survey, using the map controls or the Navigation frame, in which you can enter your coordinates, or read them from the GPS receiver, or enter your address. Click Go to Location to load the map of the corresponding area. When you are satisfied with the area selection and zoom level, click Use Map. Note that the application will use the map image as you see it, with the selected zoom level and size in pixels as in the map loader window (the window can be resized). Be sure to select the area correctly and to set a zoom level that meets your needs, as you will not be able to resize the map or zoom in/out at a later time. When you open the map loader window, TamoGraph temporarily returns control over your Wi-Fi adapter to the operating system so that you can connect to the Internet and load the map. If a Wi-Fi connection to your AP is not established, connect your computer to the Internet over a wired connection, close the map loader window, and open it again.
Calibration
![]() Once the project has been created, you will be prompted to calibrate the floor plan or site map. Calibration is the process by which you “tell” the application about the map dimensions (and coordinates, if you perform a GPS survey). Depending on the survey mode selected on the toolbar, clicking the Calibrate button on the toolbar (the right button on the illustration) will allow you to perform either standard (non-GPS) calibration or GPS calibration. GPS calibration is performed if the GPS survey mode is selected (the “satellite” button on the illustration). In all other cases, standard calibration is performed.
Once the project has been created, you will be prompted to calibrate the floor plan or site map. Calibration is the process by which you “tell” the application about the map dimensions (and coordinates, if you perform a GPS survey). Depending on the survey mode selected on the toolbar, clicking the Calibrate button on the toolbar (the right button on the illustration) will allow you to perform either standard (non-GPS) calibration or GPS calibration. GPS calibration is performed if the GPS survey mode is selected (the “satellite” button on the illustration). In all other cases, standard calibration is performed.
Standard Calibration (non-GPS)
To calibrate the map in this mode, you need to know the distance between two points on the map. That can be the distance between two walls or windows. Click on the first point of the distance, and move the mouse pointer to the second point while holding down the left mouse button. Release the left mouse button when the mouse pointer is over the second point. A red line indicating the distance will be shown. At the bottom of the screen, enter the length of the red line and click Apply.
GPS Calibration
GPS functionality is available to Pro License users only.
To prepare the map for a GPS survey, you need to add at least three reference points with known geographic coordinates. To create a new reference point, click Add new and drag the point marker to a location on the map whose coordinates you want to enter. After that, you can do one of the following:
- Enter the coordinates of that point if you know them, or
- Walk or drive to that point and use your GPS receiver to get your current coordinates.
If you use the first method, simply enter the latitude and longitude of the new point in the corresponding fields on the left in one of the standard coordinate formats—e.g., 50.435237, 50° 26' 6.85" N, or 50° 26.114' N. Be sure to double-check the numbers that you enter. Entering precise coordinates is extremely important for the accuracy of the subsequent data collection and analysis. If you use the second method, turn on your GPS receiver, connect it to your computer, and click Get from GPS Receiver. TamoGraph will then connect to the GPS receiver (or display a GPS configuration dialog, if you have not configured it) and read your current coordinates. Once the latitude and longitude have been entered, click Set to save the coordinates of the first point.
Repeat these steps for all points. The points should be as far apart as possible and not located on a straight line. You can enter more than three reference points, but this is usually not necessary if your site map has correct proportions. Click Apply when done.
Configuration
Before proceeding to data collection, you may want to configure some of the application settings and project properties, although this is not mandatory. Available settings and options are described in the Configuring TamoGraph chapter. Specifically, it is recommended that you configure WLAN requirements. This is helpful for a quick and easy evaluation of the overall health of your WLAN and detection of potential issues.
Adapter Signal Level Correction
Because TamoGraph supports a large number of different Wi-Fi adapters in various form factors, using various antennas, it is impossible to ensure that the signal level readings provided by these adapters are exactly the same. You may want to correct the signal levels reported by your adapter using the functionality described below, so that passive surveys conducted using different adapters would have a similar baseline.
This feature is intended for advanced users only. Please do not utilize it unless you have a very good understanding of what exactly you are doing. If you want to simulate clients with different adapter sensitivity levels, consider using the Client Capabilities configuration instead.
To access this functionality, either click Settings => Adapter Signal Level Correction or double-click on the adapter name in the left corner of application the status bar. The configuration dialog allows you to specify a pair of negative or positive values (one per frequency band) in dBm by which the raw signal levels reported by the adapter will be corrected. The values that you enter are saved as a preset associated with the specific adapter model. If you use different adapters, each adapter will have its own correction levels (if any are specified). Clicking Reset sets the correction levels to zero.
Once you have entered the values and clicked OK, the specified correction levels (if they are non-zero) will be shown next to the adapter name in the status bar. This allows you to see if any corrections are being applied without opening the configuration dialog.
Corrections affect all packets received during passive surveys, as well as the real-time signal levels shown in the AP list on the left panel. Corrections DO NOT affect data recorded in previously conducted surveys; they are NOT retroactive.
Data Collection
Once the ![]() project configuration has been completed, you are ready to perform the actual survey by walking the site with a laptop that runs TamoGraph (unless you perform predictive modeling, where no on-site data collection is necessary). To facilitate the data collection process, TamoGraph offers three survey modes that can be selected by pressing the corresponding buttons on the toolbar: Continuous (the left button on the illustration), Point-by-Point (the middle button on the illustration), and GPS (the right button on the illustration) for GPS-assisted outdoor surveys.
project configuration has been completed, you are ready to perform the actual survey by walking the site with a laptop that runs TamoGraph (unless you perform predictive modeling, where no on-site data collection is necessary). To facilitate the data collection process, TamoGraph offers three survey modes that can be selected by pressing the corresponding buttons on the toolbar: Continuous (the left button on the illustration), Point-by-Point (the middle button on the illustration), and GPS (the right button on the illustration) for GPS-assisted outdoor surveys.
GPS functionality is available to Pro License users only.
In the default continuous mode, after you mark your initial location on the map by clicking on it, the application scanner continuously scans the air by sweeping through the Wi-Fi channels. When you mark the next location on the map, the data that has been collected between the two clicks on the map is spread evenly along the path between the two data points. This means that your path should consist of straight lines and that you should walk steadily, clicking on the map every time you change direction.
In the point-by-point mode, TamoGraph collects data only when you click on the map. In that mode, you should stay where you are after marking your location on the map, until the scanner completes the cycle. Then the scanner stops, until you mark your next location, where the scanner makes another full cycle. This means that your path can have any shape, but less data will be collected, as compared to the continuous mode, and a smaller area will be covered.
In the GPS mode, the data collection process is similar to the one in continuous mode, but th e location is automatically determined by the GPS receiver connected to the computer. Continuous and Point-by-Point surveys can be conducted both indoors and outdoors; GPS surveys can be conducted outdoors only, as GPS receivers cannot receive location data when indoors.
Before you begin, spend some time thinking through your walkabout path. Decide which areas you need to survey and how you are going to do that. Remember that it is quite all right to mix the three data collection modes—that is, you can survey some areas where walking steadily in a straight line is not a problem in continuous mode; you can then survey other areas in point-by-point mode, and then survey the area outside the building in GPS mode. You can also stop the survey at any moment and continue after a break, as you can select several survey segments for data analysis. Once you have thought through your walkabout path, begin the actual survey.
TamoGraph allows you to perform two types of surveys: active and passive (or both at the same time). Every time you start data collection, you will be prompted to select the type of survey, as shown below.
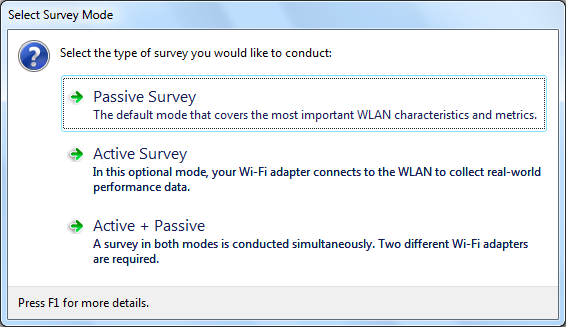
It is extremely important to understand the difference between the two survey types, as they focus on different WLAN characteristics. Please refer to Understanding Survey Types: Passive, Active, and Predictive for more information. When performing an active survey, an additional configuration dialog is displayed before you can start data collection. This dialog is explained in the Active Survey Configuration chapter. Additionally, when a compatible spectrum analysis device is connected to the computer, you will be able to collect spectrum data either in parallel with a passive survey (the first dialog option will be titled Passive Survey + Spectrum Survey) or in spectrum-only mode (another option titled Spectrum Survey will be added to the dialog).
Continuous Mode: To start data collection, click on the Start button (illustrated on the left) and then mark your initial location on the map by clicking on the![]() corresponding spot. Walk along the planned path at a steady pace in a straight line. You should walk a bit slower than you normally do. Every time you reach the end of the straight line on your path (i.e., every time you need to change direction), click on the map again to mark your current location. Data collection
corresponding spot. Walk along the planned path at a steady pace in a straight line. You should walk a bit slower than you normally do. Every time you reach the end of the straight line on your path (i.e., every time you need to change direction), click on the map again to mark your current location. Data collection ![]() stops when you click on the Stop button (illustrated on the right.) If you want to suspend data collection temporarily without stopping your current survey (e.g. when you want to answer a phone call and then continue), click on the Pause button (illustrated on the left) to pause the survey and then click it again to
stops when you click on the Stop button (illustrated on the right.) If you want to suspend data collection temporarily without stopping your current survey (e.g. when you want to answer a phone call and then continue), click on the Pause button (illustrated on the left) to pause the survey and then click it again to ![]() resume. Important: if you paused the survey, you can move freely, but you must return to the exact location where you paused the survey before you resume it, otherwise your survey data will be invalid.
resume. Important: if you paused the survey, you can move freely, but you must return to the exact location where you paused the survey before you resume it, otherwise your survey data will be invalid.
Point-by-Point Mode: To start data collection, click on the Start button. Mark your location on the map by clicking on the corresponding spot. TamoGraph will collect data by scanning the channels twice and display a notification at the bottom of the window when all the data has been collected. Proceed to the next point on your path and mark your location again. Repeat until you have surveyed all the planned points. Data collection stops when you click on the Stop button.
GPS Mode: To start data collection, turn on your GPS receiver, con![]() nect it to your computer, and then click on the Start button. Your current location will be displayed on the map with a circle. Make sure that the displayed location matches your actual location. If it does not, you made a mistake while calibrating the map with reference points, and you need to re-calibrate the map. Walk or drive slowly along the planned path. The slower you drive, the more Wi-Fi data will be collected, and the more accurate the data analysis will be. GPS surveys can be conducted outdoors only, in open areas where a GPS receiver can see many satellites. Location data accuracy is directly related to the number of satellites in view. As you move along the path, location data accuracy is indicated on the application status bar, as shown on the illustration. If location data accuracy becomes poor, you may want to stop the survey until more satellites become visible to the receiver (you can click on the data accuracy indicator to display the GPS receiver configuration dialog that displays accuracy level and visible satellites). Data collection stops when you click on the Stop button.
nect it to your computer, and then click on the Start button. Your current location will be displayed on the map with a circle. Make sure that the displayed location matches your actual location. If it does not, you made a mistake while calibrating the map with reference points, and you need to re-calibrate the map. Walk or drive slowly along the planned path. The slower you drive, the more Wi-Fi data will be collected, and the more accurate the data analysis will be. GPS surveys can be conducted outdoors only, in open areas where a GPS receiver can see many satellites. Location data accuracy is directly related to the number of satellites in view. As you move along the path, location data accuracy is indicated on the application status bar, as shown on the illustration. If location data accuracy becomes poor, you may want to stop the survey until more satellites become visible to the receiver (you can click on the data accuracy indicator to display the GPS receiver configuration dialog that displays accuracy level and visible satellites). Data collection stops when you click on the Stop button.
When you are through with the survey, you can proceed to the data analysis of a passive and/or active survey. However, before you do, it is recommended that you read the next three chapters, especially if you are new to Wi-Fi site surveys. They provide important information about the available types of surveys, their purpose, as well as some valuable tips and tricks to make your site surveying more efficient.
Understanding Survey Types: Passive, Active, and Predictive
There are three types of surveys that you can conduct in TamoGraph: passive, active, and predictive (the latter is technically not a survey; rather, it’s virtual modeling). During a passive survey, the application collects the most comprehensive data on the RF environment: information on access points and their characteristics, signal strength, noise level, interference, etc. This is the default and most important survey type that we recommend to conduct for every project. If you need more insight into the real-world performance of your WLAN, TamoGraph can also perform an active survey. During active surveys your Wi-Fi adapter connects to the wireless network(s) of your choice and the application generates network traffic to measure actual throughput rates and a few other metrics. In addition to the surveys based on actual on-site measurements, TamoGraph can be used for planning WLANs that have not been deployed yet. This is called “RF predictive modeling” or “RF planning”, because Wi-Fi characteristics are predicted for the virtual environment model created by the user. The virtual model includes walls and other obstructions, as well as virtual APs placed by the user. In other words, it is a computer simulation. No on-site measurements are conducted.
The table below summarizes the distinctions between the survey types. Please read this information carefully to make sure you fully understand which survey type you need.
| Passive Surveys | Active Surveys | Predictive Modeling | |
| When to conduct | Highly recommended at all times. The most comprehensive survey type that covers the most important WLAN characteristics and metrics. | Optional. Conduct when measurement of real-world performance characteristics of your WLAN is required. | Optional. Conduct before deployment to plan your WLAN and simulate its characteristics. |
| Hardware requirements | On Windows, a compatible wireless adapter is required. For the up-to-date list of compatible adapters, please visit our website. On macOS, no specific adapter is required; the application will work with the built-in adapter of your MacBook. | On Windows, virtually any modern wireless adapter with the latest drivers supplied by the adapter vendor will work. On macOS, no specific adapter is required; the application will work with the built-in adapter of your MacBook. | A fast multicore CPU. Intel i7 is highly recommended. No wireless adapter is required. |
| Additional software configuration requirements | None | You must create a Windows profile for the WLAN you plan to test. On macOS, the WLAN you plan to test must be listed under Preferred Networks. If you plan to measure TCP and/or UDP throughput, you must also run the throughput server utility on the wired side of your WLAN. | None |
| How data is collected | The application passively listens for packets and does not attempt to connect to WLANs. | The application connects your Wi-Fi adapter to the wireless network(s) of your choice to measure actual throughput rates and a few other metrics. | No on-site data collection is performed. Data is simulated based on the virtual environment that you created. |
| Available visualizations | Signal Level Signal-to-Noise Ratio Signal-to-Interference Ratio AP Coverage Areas Number of APs Expected PHY Rate Frame Format Channel Bandwidth Requirements |
Actual PHY Rate TCP Upstream Rate* TCP Downstream Rate* UDP Upstream Rate* UDP Downstream Rate* UDP Upstream Loss* UDP Downstream Loss* Round-trip Time Associated AP Requirements |
Same as for passive surveys |
| List of APs and their characteristics is available | Yes | No | Yes |
| Surveys can be conducted simultaneously | On Windows – yes. You can conduct a simultaneous Active + Passive survey if your computer is equipped with two different Wi-Fi adapters. One of them must be compatible with passive surveys; for the up-to-date list of compatible adapters, please visit our website. On macOS – yes, if you use one of the compatible USB adapters for the passive part of the survey and the built-in MacBook adapter for the active part of the survey. | Not applicable | |
* When using advanced mode with a throughput server utility connection. See Survey Type Selection for more info.
As mentioned above, some additional software configuration is required when performing an active survey. The next chapter provides detailed information on how to configure TamoGraph for an active survey.
Active Survey Configuration
When you click the Active Survey or Active + Passive button in the survey type selection dialog, an additional configuration dialog is displayed as shown below.
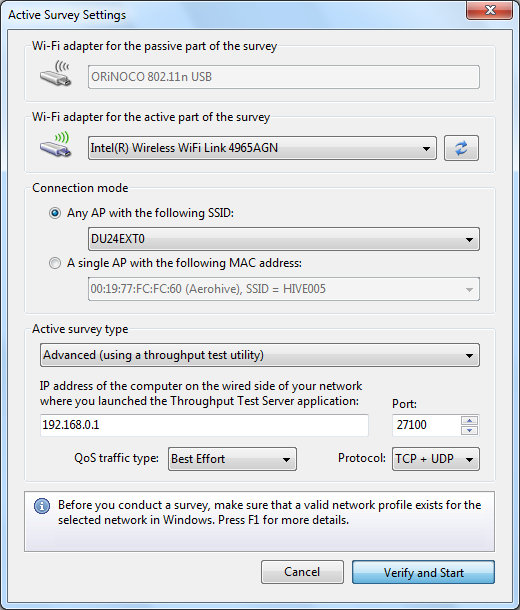
This dialog allows you to configure TamoGraph for an active survey you are about to conduct.
Adapter Selection
The adapter selection section can be used to specify which Wi-Fi adapter to utilize for an active survey and which one for the passive survey (if you are conducting both survey types simultaneously, in the Active + Passive mode.)
- If your computer has only one Wi-Fi adapter, you cannot change the default selection; that adapter will be used for the active survey.
- If your computer has two Wi-Fi adapters and you are conducting both survey types simultaneously, in the Active + Passive mode, you cannot change the default selection, either; the adapter that is compatible with passive surveys will be used for the passive part of the survey, while the other adapter will be used for the active part of the survey.
- If your computer has two Wi-Fi adapters and you are conducting an active survey only, you can select either of the two adapters. We recommend that you use the integrated adapter for active surveys. For example, if your laptop comes with an integrated Wi-Fi Intel adapter and you also use a Wi-Fi USB adapter, select the integrated Intel adapter.
Please keep in mind that the WLAN metrics that are measured during an active survey depend on the capabilities of your adapter. If your adapter's capabilities are inferior to the capabilities of your WLAN, this will be reflected in the results obtained during the survey. For example, if your APs support the 802.11ax standard with the maximum rate of over a thousand Mbps, whereas your Wi-Fi adapter is a legacy 802.11ac device with the maximum rate of 867 Mbps, the measured PHY rate and throughput rates will never exceed 867 Mbps, thereby giving you an underrated picture of the WLAN performance.
Connection Mode Selection
There are two connection methods for performing active surveys: the SSID method and the MAC address method (also frequently referred to as the “BSSID method”).
- The SSID method allows the client to associate to the selected SSID and roam between multiple APs that share the selected SSID. This mimics real-world client roaming behavior. Note that some adapters let you adjust roaming thresholds; these roaming settings might affect the performance data.
- The MAC address method locks a client into the MAC address of the AP and prevents the client from roaming. This allows you to analyze the connectivity zone and performance metrics of a single AP.
Note that for the MAC address method to work, support of this functionality is required from the operating system and the driver. The combination of the adapter model, OS, and the driver determine whether this method will work. If TamoGraph notifies you that this method is not supported, use the SSID method and create a temporary SSID specific to a single AP, which will let you bypass this problem.
Which of the two methods you choose depends on the specific purposes of your survey. The first method is typically used in post-deployment scenarios, while the second one is typically used on the deployment stage. If you use the first method, select the desired SSID from the drop-down list. If your WLAN doesn't broadcast its SSID, select the <Non-broadcast SSID> item and you will be prompted to choose the network profile for that WLAN at a later stage. If using the second method, select the desired AP from the drop-down list.
Because performing active surveys involves a full association to a WLAN, you must properly configure security settings prior to the survey. Be sure to follow this checklist:
- When TamoGraph is not running, make sure that the client adapter you plan to use for active surveys can connect to the AP(s) and/or SSIDs you plan to connect to during an active survey. This must be a single-click connection right from the Wi-Fi system icon of Windows or macOS. You must not be prompted for any additional credentials. If a username or password is required, they must be cached by Windows/macOS. If other authentication, such as a smart card, is required, it too must be performed without requiring any user input.
- Using third party authentication supplicants is not supported; the OS must be able to complete authentication by itself. In other words, a valid network profile for the given WLAN and the selected client adapter must exist in the OS.
- Sometimes existing WLAN security configuration does not allow you to associate under the conditions described above. In such cases, we suggest that you create a temporary SSID with no or WPA-PSK security. Create a firewall rule to prevent clients using that temporary SSID from accessing any important intranet resources and delete that temporary SSID when you are done with the survey.
Survey Type Selection
Once an active survey has been started and the client associated to a WLAN, TamoGraph begins to measure client performance. You can select the Basic or Advanced active survey type.
In the Basic mode, the client sends pings to the computer on the wired side of the network at the specified IPv4 or IPv6 address. This mode is the easiest to configure: Simply enter the IP address of a host that can respond to ping packets (this may be a computer or other ping-capable type of hardware, e.g., an AP.) Make sure that the firewall rules on the client side and the host side permit ping (also known as ICMP) request and response packets. The drawback of the Basic mode is that no data throughput measurements can be performed. Only the following visualizations will be available: Actual PHY Rate, Round-trip Time, Associated AP, and Requirements.
In the Advanced mode, TamoGraph connects to a throughput test server utility on the wired side of the network at the specified IPv4 or IPv6 address and port. During the survey, TamoGraph is continuously sending and receiving packets to/from the server utility and records performance data. This mode is a bit more difficult to configure, but you get much more data as a result of throughput testing. In addition to the Actual PHY Rate, Round-trip Time, Associated AP, and Requirements visualizations, you also get TCP Upstream and Downstream Rate, UDP Upstream and Downstream Rate, and UDP Upstream and Downstream Loss.
The only additional step required to use the Advanced mode is copying the throughput test server utility from the computer where TamoGraph is installed to the host on the wired side of the network and running the utility. On 32-bit Windows, the utility executable file can be found at:
You will see the utility window as shown below.
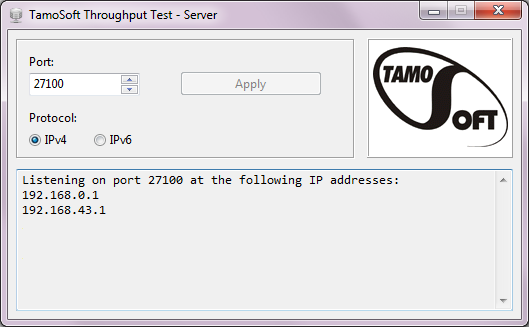
Alternatively, the throughput test server utility for Windows or macOS can be downloaded from our website at https://www.tamos.com/products/throughput-test/. It is part of our freeware product, TamoSoft Throughput Test. Install the product and use the Run Server command.
In the Active Survey Configuration dialog, select the protocols you want to test: TCP (default) or TCP+UDP, if you are interested in UDP performance metrics, too. Advanced users may want to change the QoS traffic type (described in the next chapter.)
You are now ready to start an active survey. Always start active surveys when you are close to the AP your client will connect to, in the area where the signal level is high. This will allow the application to quickly validate the settings and start data collection. DO NOT start active surveys in the areas where the signal level is insufficient for stable connectivity. Click Verify and Start to proceed.
QoS Testing
If you are not an advanced user and not familiar with the concept of QoS, you do not need to read this chapter; just leave the default Best Effort selection in the QoS traffic type control and begin the survey.
Advanced users might want to use the QoS traffic type control to specify the Quality of Service traffic type that will be associated with the TCP and UDP data streams that are sent and received by the application. A description of the use of QoS and related standards and technologies, such as WMM, 802.11e, DSCP, and 802.11p, is beyond the scope of this manual, but in brief, you might want to use this functionality t o check how different QoS traffic types affect throughput. In a properly designed WLAN that uses enterprise-class APs, throughput values for high-priority traffic should exceed those for normal-priority traffic.
The table below summarizes different QoS traffic types that may be used. Please pay attention to the fact that not all the QoS types available in the application and described below have corresponding WMM access categories. In practice, this means that when you select a QoS type that has no WMM mapping, your Wi-Fi adapter driver might fail to QoS-tag packets at all.
| QoS Type | Description |
| Best Effort | Flow traffic has the same network priority as regular traffic not associated with QoS. This traffic type is the same as not specifying priority, and as a result, the DSCP mark and 802.1p tag are not added to sent traffic. Corresponds to the WMM AC-BE access category. |
| Background | Flow traffic has a network priority lower than that of Best Effort. This traffic type could be used for traffic of an application doing data backup. Sent traffic will contain a DSCP mark with a value of 0x08 and an 802.1p tag with a value of 2. Corresponds to the WMM AC-BK access category. |
| Excellent Effort | Flow traffic has a network priority higher than Best Effort, yet lower than AudioVideo. This traffic type should be used for data traffic that is more important than normal end-user scenarios, such as e-mail. Sent traffic will contain a DSCP mark with value of 0x28 and 802.1p tag with a value of 5. This does not correspond to any WMM access category. |
| AudioVideo | Flow traffic has a network priority higher than Excellent Effort, yet lower than Voice. This traffic type should be used for A/V streaming scenarios such as MPEG2 streaming. Sent traffic will contain a DSCP mark with a value of 0x28 and an 802.1p tag with a value of 5. Corresponds to the WMM AC-VI access category. |
| Voice | Flow traffic has a network priority higher than AudioVideo, yet lower than Control. This traffic type should be used for real time voice streams such as VOIP. Sent traffic will contain a DSCP mark with a value of 0x38 and an 802.1p tag with a value of 7. Corresponds to the WMM AC-VO access category. |
| Control | Flow traffic has the highest network priority. This traffic type should only be used for the most critical of data. For example, it may be used for data carrying user inputs. Sent traffic will contain a DSCP mark with a value of 0x38 and an 802.1p tag with a value of 7. This does not correspond to any WMM access category. |
Best Practices, Tips, and Tricks
- If the WLAN being surveyed has SSID broadcasting disabled, enable it for the duration of the survey, if possible. This will facilitate the identification of the APs you would like to have included in the data analysis.
- Fully charge your laptop and be prepared to recharge it. Having an extra battery on hand would not hurt. However, if your laptop goes into standby or hibernation while you are performing a survey, TamoGraph will save the data and stop the active survey. You will be able to continue where you stopped.
- When you conduct GPS surveys, the survey process is fully automated; normally you do not need to touch any application controls, so you may want to close the laptop lid. If you plan to close the lid, be sure to configure the laptop power settings to prevent the laptop from going into standby or hibernation when you close the lid.
- Plan your walkabout path in advance. You may want to write down numbers on the site map marking your path. Then, while surveying, you would just have to walk along the path and click on these numbers. When planning your path, be sure to plan it so that you capture the perimeters of the rooms rather than their center. This improves data quality.
- If you care about signal leakage outside the building, plan your path along the outside building perimeter. Without this perimeter, TamoGraph will not be able to estimate the signal strength outside the walls.
- Be sure to cover places of special importance, such as conference rooms or the CEO's office. Survey them with closed doors. Closed doors may considerably decrease the signal level, so surveying with open doors may give you a signal coverage map that is too optimistic.
- If the site is large, consider splitting the site map into several parts, as working with smaller maps is easier. Besides, the report generated by TamoGraph will be more meaningful if separate maps are used for separate zones. A large map just will not be legible if has to be displayed on one page. You can have as many maps as you wish in a single TamoGraph project. The same applies to multi-floor buildings.
- If the site is large, you can also split the job between several people sharing the same project. The correct way of doing this is described in the Survey Job Splitting chapter.
- If you are going to survey a large facility with many employees during business hours, make an announcement telling them that someone will be conducting a survey. Ideally, this will prevent them from distracting you with questions.